
Figure 6.
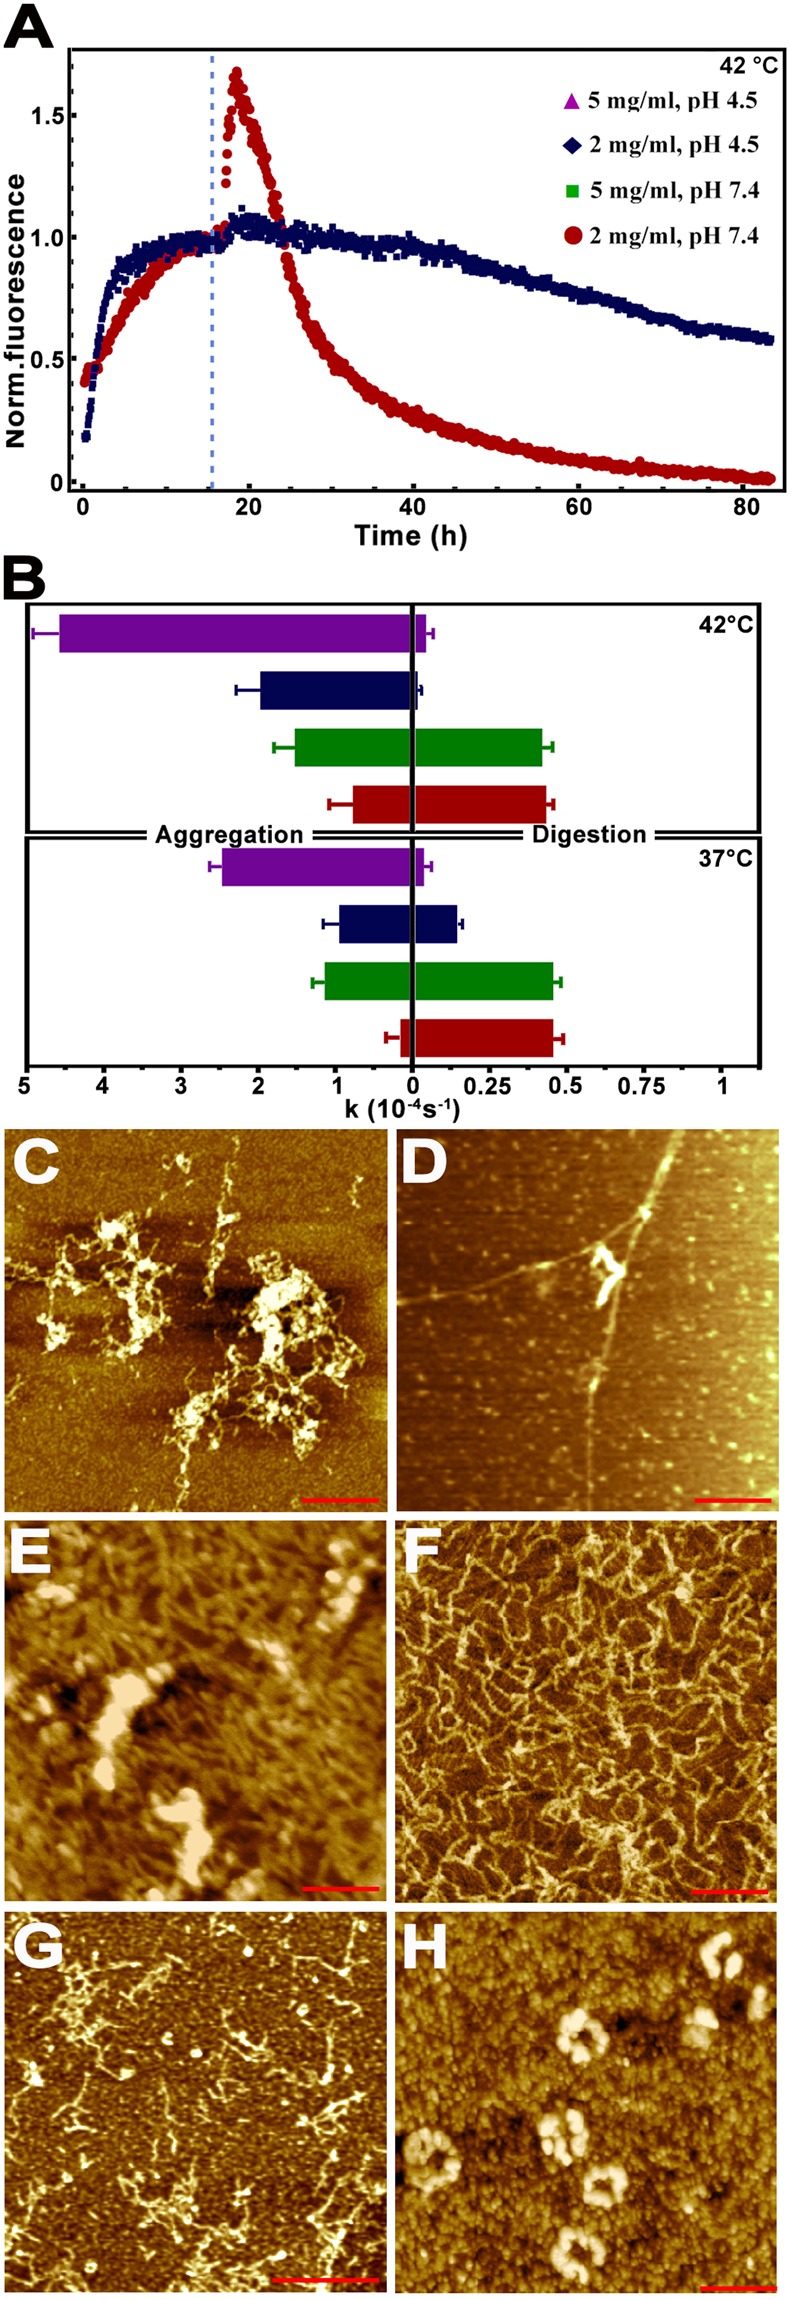
In vitro S100A9 amyloid formation and proteinase K digestion. (A) Kinetics of S100A9 amyloid formation and proteinase K digestion monitored by h-FTAA fluorescence at 42 °C. Time of protease K addition is indicated by dashed line. (B) Rate constants of S100A9 amyloid formation (left) and proteinase K digestion (right), shown by bars and corresponding to 42 °C (top) and 37 °C (bottom), represent mean ± standard deviation (n = 10 repeats for each kinetic measurement). Kinetic data observed at 5 mg/ml, pH 4.5 is shown in purple, at 2 mg/ml, pH 4.5 – in dark blue, 5 mg/ml, pH 7.4 – in green and 2 mg/ml, pH 7.4 – in red, as indicated in figure legend (A). Representative AFM height images of (C) S100A9 amyloid clumps formed in 10 mM PBS, pH 7.4, 37 °C, during 12 h under shaking with glass beads; (D) the same sample after 6 h proteinase K digestion. Representative AFM height images of (E) S100A9 amyloid clumps and fibrils formed in 20 mM sodium acetate, pH 4.5, 42 °C, during 8 h under shaking with glass beads; (F) the same sample subjected to 3 h, (G) 6 h and (H) 12 h proteinase K digestion. Scale bars are 250 nm in (C–F) and 600 nm in (G,H), respectively.