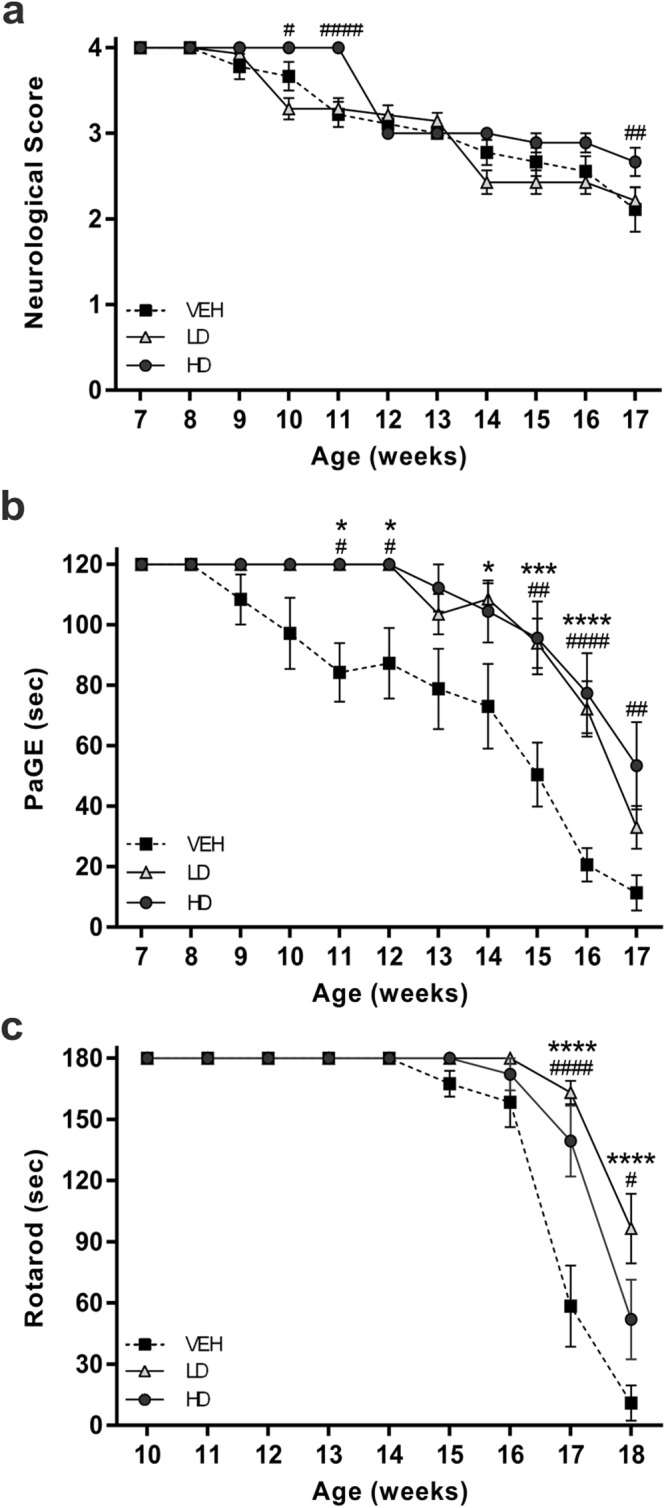
Figure 1.

Motor performances of SOD1(G93A) mice. The graphs show the motor performances of SOD1(G93A) mice treated with vehicle (VEH) or with the pharmacological combination of resveratrol and MS-275 at low or high doses (LD and HD, respectively). (a) Neurological Score test shows statistically significant differences comparing HD (black circle) with VEH (black square) groups (VEH vs HD, ##P = 0.0153). (b) PaGE test shows a significant improvement of motor performance of LD (white triangle) and HD groups comparing to VEH mice (VEH vs LD, ***P = 0.0007; VEH vs HD ##P = 0.004). (c) Rotarod test shows a significant improvement of motor coordination of LD and HD groups starting from the 15th week. Note that the VEH group showed a faster decline of performances (VEH vs LD, ***P = 0.0006; VEH vs HD #P = 0.0108). Results were analyzed by two-way ANOVA followed by Bonferroni multiple comparisons test. * was used to indicate differences between VEH and LD groups, while # was used to indicate differences between VEH and HD groups. Data in all graphs are expressed as mean ± SEM.
