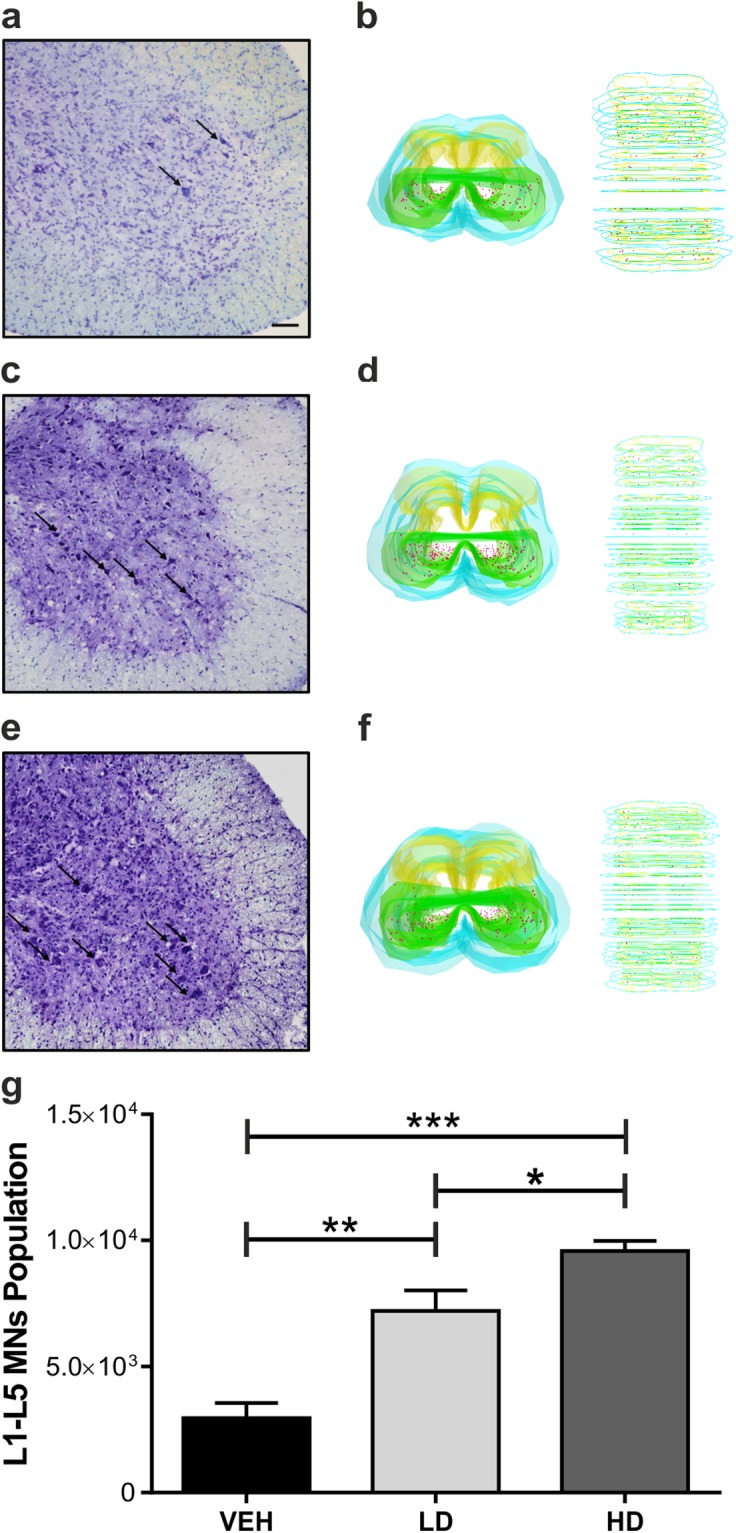
Figure 3.

Number of MNs of the lumbar spinal cord of SOD1(G93A) mice. Treatment with epigenetic drugs increases the MNs survival in the lumbar spinal cord (L1-L5). (a–c) Nissl staining on the L5 segment of the spinal cord of VEH (n = 5) (a), LD (n = 5) (b) and HD (n = 5) (c) shows an increase of the numbers of MNs (arrows) in LD and HD mice compared to VEH. (d) 3D reconstruction of VEH lumbar spinal cord. (e) The graph shows the number of MNs population of the L1-L5 tract of the spinal cord of animal groups. Note a significant augment of the number of MNs population in a dose-dependent manner. Magnification 20×, scale bar 100 μm. Results were analyzed by one-way ANOVA followed by Tukey’s multiple comparisons test. Data are expressed as mean ± SEM. *p < 0.05, ** p < 0.01, ***p < 0.001.
