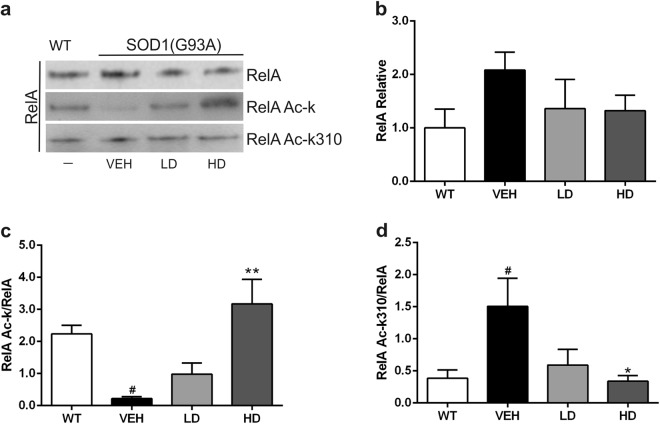
Figure 4.
Immunoprecipitation and densitometric analysis of RelA subunit. Acetylation of RelA protein in the lumbar spinal cord of WT and VEH, LD and HD SOD1(G93A) mice. (a) Representative picture of the co-immunoprecipitation analysis of RelA acetylation in nuclear proteins extracted from lumbar spinal cord tissues. (b) Densitometric analysis of immunoprecipitated RelA. Despite a slight increase of the RelA expression in VEH group, no statistical differences were detected between the groups (c) Graph showing the amount of total RelA acetylated in relation to the RelA immunoprecipitated. The RelA acetylation was statistically reduced in VEH group compared to WT (WT vs VEH, #P = 0.0324) while the treatment with the drugs at high doses significantly increased the acetylation of RelA (VEH vs HD, **P = 0.0024). (d) The graph shows the acetylation of K310 in relation to the RelA immunoprecipitated. The acetylation at K310 of RelA was increased in VEH group compared to WT (WT vs VEH, #P = 0.0446). The treatment decreases the RelA K310 acetylation in HD group compared to VEH (VEH vs HD, *P = 0.036). All gels and blots were processed in parallel showing similar results. All the graphs show the densitometry analysis of immunoblot bands expressed as mean ± SEM. All data are expressed as the percentage of WT corresponding values. Results were analyzed by one-way ANOVA followed by Tukey’s multiple comparisons test. # indicates p < 0.05 of the interested group vs WT group; * and ** indicate p < 0.05 and p < 0.01 respectively of the interested group vs VEH group. Full length blots are shown in Supplementary Information, in Supplemental Fig. 1.

