Figure 6.

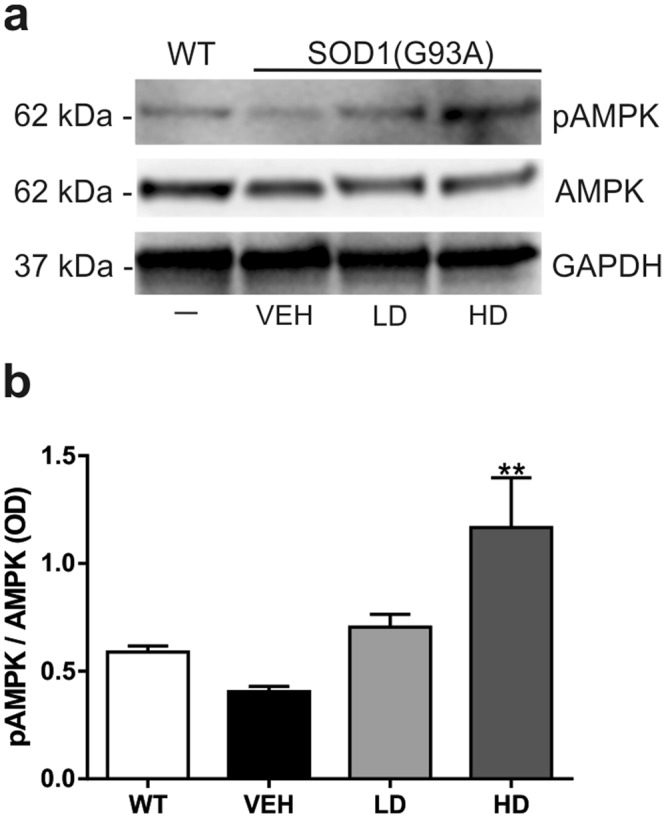
Analysis of phosphorylation of AMPK. Western blot assay was performed in the cytoplasmic fraction of the lumbar spinal cord of WT mice and VEH, LD and HD SOD1(G93A) groups (n = 3 per group). (a) Representative western blot image showing the phosphorylation rate pAMPK (62 kDa) and the expression of AMPK (62 kDa) and GAPDH (37 kDa). (b) The graph shows the densitometric analysis of the phosphorylation of pAMPK compared to the total expression of AMPK. The VEH show a slight decrease (not significant) of the phosphorylation of AMPK compare to WT. The treatment increase the pAMPK/AMPK ratio and significant differences were found between VEH and HD group (VEH vs HD, **P = 0.089). All gels and blots were processed in parallel showing similar results. Results were analyzed by one-way ANOVA followed by Tukey’s multiple comparisons test. Graphs are shown as mean ± SEM. * and ** indicate p < 0.05 and p < 0.01 respectively of interested group vs VEH group. Full length blots are shown in Supplementary Information, in Supplemental Fig. 2.
