Figure 7.

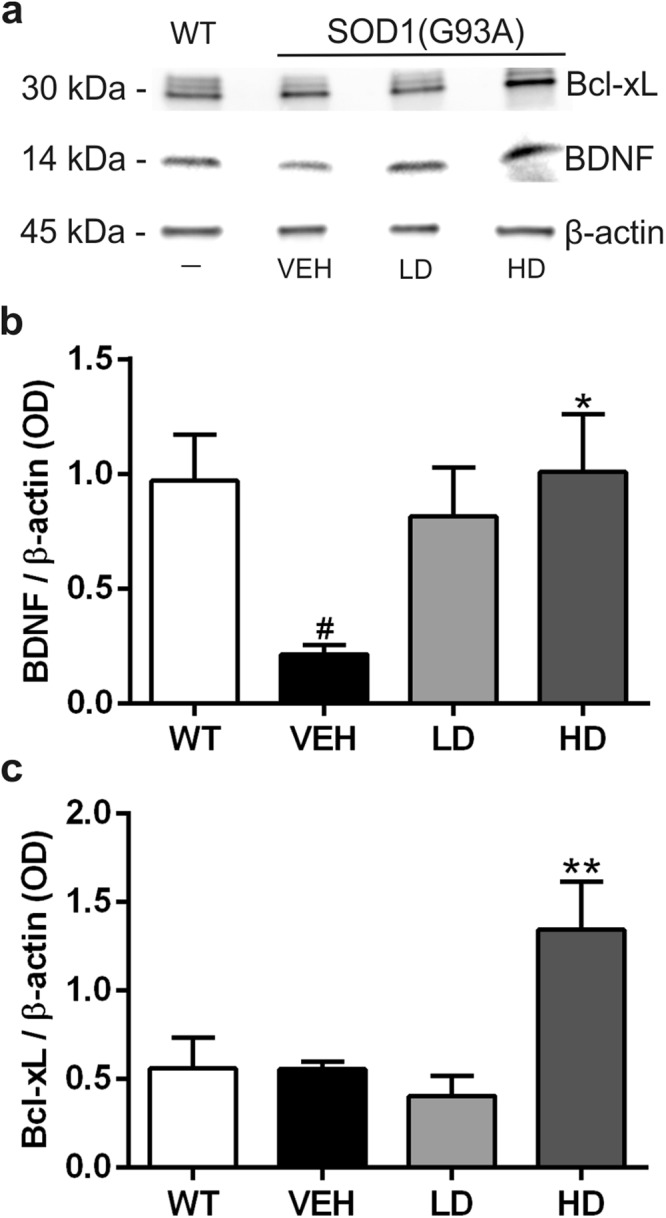
Analysis of neurotrophic (BDNF) and anti-apoptotic (Bcl-xL) factors expression levels. Western blot assay was performed in the cytoplasmic fraction of the lumbar spinal cord of WT mice and VEH, LD and HD SOD1(G93A) groups (n = 5 per group). (a) Representative western blot image depicting the expression of BDNF (14 kDa), Bcl-xL (30 kDa) and β-actin (45 kDa). (b–c) Densitometric analysis of the expression of BDNF and Bcl-xL normalized to β-actin. In (b) note the significantly decreased expression of BDNF in VEH group compared to WT (WT vs VEH, #P = 0.0280) and the increase of BDNF expression after drugs treatment, statistically significant in HD group (VEH vs HD, *P = 0.0206). In (c) note the significant increase of Bcl-xL expression after the treatment with the high dose of drugs (VEH vs HD **P = 0.0054). All gels and blots were processed in parallel showing similar results. Results were analyzed by one-way ANOVA followed by Tukey’s multiple comparisons test. Graphs are shown as mean ± SEM. #indicates p < 0.05 of interested group vs WT group; * and **indicate p < 0.05 and p < 0.01 respectively of the interested group vs VEH group. Full length blots are shown in Supplementary Information, in Supplemental Fig. 3.
