Figure 6.
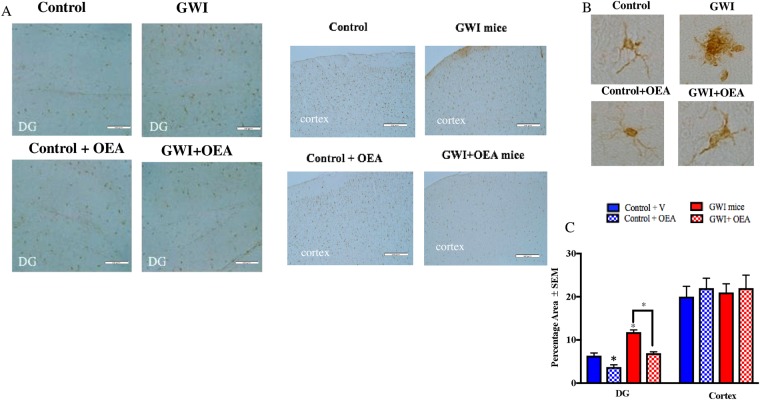
OEA treatment reduced microglia proliferation in GWI mice. Light microscopy images showing staining of microglia with IBA-1 (n = 4 per group, 4 serial section for each brain). Scale bar 50 μm. (A) Images show 20x Iba1 staining in the cortex and DG of mice from all 4 treatment groups. (B) Images show 100x magnification of Iba1 stained astroglia in the cortex of each study treatment group. (C) Quantification of Iba1 staining from 20x images. Levels of Iba1 staining within the DG was lower in OEA treated GWI mice compared to GWI mice on normal chow. Levels of Iba1 in GWI mice were higher in the DG compared to control mice. There were no differences in the cortices of GWI mice compared to control or OEA treated GWI mice *p ≤ 0.05.

