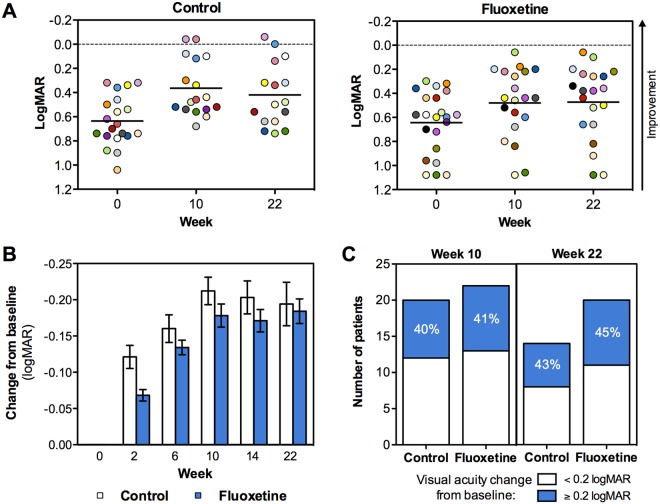
Figure 3.
Improvement of visual acuity. (A) Scatter plots showing each individual patient’s visual acuity (amblyopic eye) at baseline, at week 10 (end of treatment/training) and at week 22 (end of follow-up), as measured by ETDRS chart (logMAR). Control group is shown on the left and fluoxetine group on the right. The limit of normal visual acuity (logMAR 0) is shown with a hatched line. (B) Average change in visual acuity from baseline as measured by ETDRS chart (logMAR) at baseline and after 2, 6, 10, 14 and 22 weeks. Average +/− 95% CI in each timepoint when visual acuity was determined by ETDRS chart is shown. (C) Number of patients per group who showed improved visual acuity by ≥0.2 or <0.2 logMAR units at week 10 and 22 as compared to baseline.

