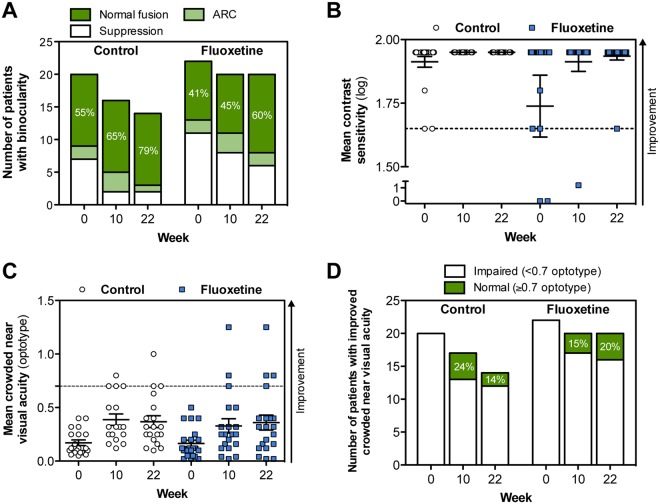
Figure 4.
Change in binocularity, contrast sensitivity, crowded near visual acuity. (A) Number of patients per group who showed change in binocular vision (suppression, anomalous retinal correspondence (ARC) or normal fusion) at week 10 and 22 as compared to baseline. Bagolini striated glass test results at 4 meter distance are shown. (B) Mean contrast sensitivity (log value) as measured by Pelli-Robson chart. Normal contrast sensitivity (1.70) is indicated by a hatched line. Only two patients in the whole patient population (n = 42) had significant contrast sensitivity impairment (i.e. 0 log) at baseline. Both patients received fluoxetine and improved to almost normal contrast sensitivity. (C) Crowded near visual acuity as measured by Landolt C ring charts. Normal crowded near visual acuity was considered as ≥0.7 (hatched line). In panels B and C, the direction of improvement is indicated by an arrow. (D) Number of patients per group who improved in crowded near visual acuity test at week 10 and 22 as compared to baseline.

