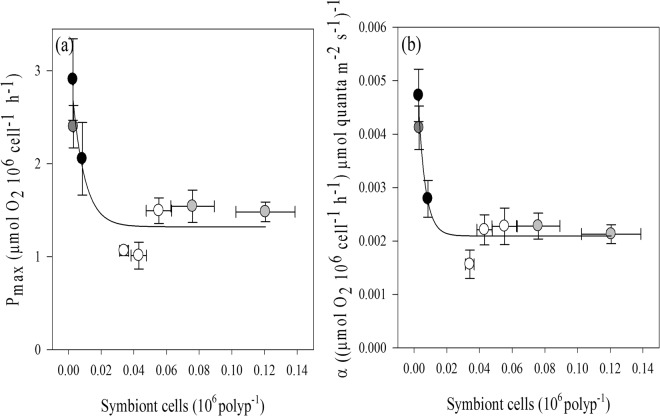
Figure 5.
Relationships between the number of symbiont cells per polyp and the photosynthetic performance of the different octocoral species, normalized by symbiont density (sea fan- dark grey circle, sea plumes- black circles, sea whips- grey circles, sea rods- white circles). Exponential relationship between symbiont density and (a) maximum photosynthetic rate (R2 = 0.82, y = 1.32 + 1.99(−133.2x), p = 0.0061) and (b) photosynthetic efficiency (R2 = 0.92, y = 0.0021 + 0.0046(−230.5x), p = 0.0008). Data represent means ± SE (n = 6).

