Figure 2.
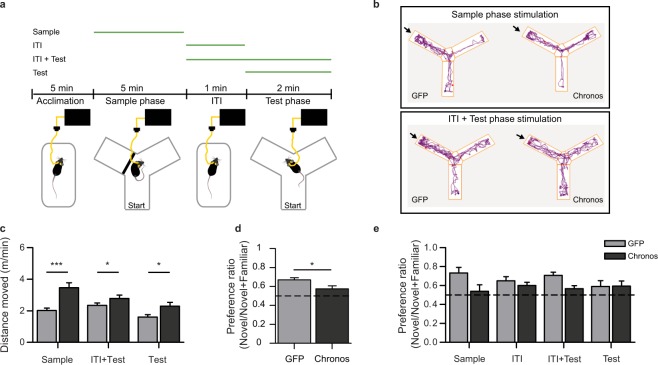
Optogenetic impairment of spatial novelty preference (SNP). (a) Illustration of the Y-maze test protocol used to assess SNP. In all cases animals were familiarized to a novel cage and the tether before introduction into the Y-maze (acclimation). Green lines above indicate the phase of optogenetic stimulation for the 4 different stimulation phases used: (1) sample phase (Sample) (2) Intra-trial interval (ITI) (3) test phase (Test) and (4) ITI and test phase (ITI + Test). (b) Example path lengths from individual GFP (left) and Chronos animals (right) are shown for exploration during the test phase following stimulation in the sample phase (top) or the ITI + Test phase (bottom). The novel arm is indicated by the arrow. (c) Optogenetically-induced hyperlocomotion was observed during stimulation for each stimulation phase during which locomotion was recorded; locomotion was not tracked in the holding cage, and is therefore not shown for the ITI only stimulation condition, and data for ITI + Test stimulation are shown for the test phase only. (d,e) Preference ratios for the novel arm calculated as the ratio of the time spent in the novel goal arm to the time spent in both goal arms. Data are presented averaged across all 4 stimulation phases (reflecting the main effect of group from the ANOVA; d) or individually for each stimulation protocol (e). The dashed lines (d–e) indicate chance level (0.5), i.e. equal preference for both goal arms. Data are shown as mean ± SEM; *p < 0.05, ***p < 0.001; t-Test or Kolmogorov-Smirnov Z-Test.

