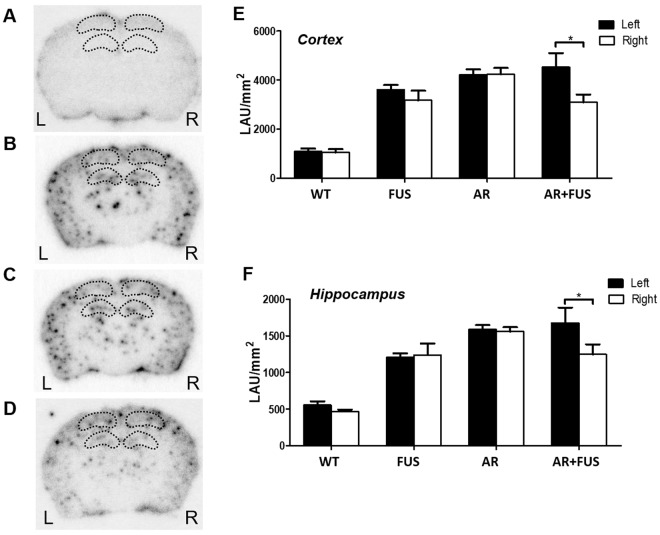
Figure 3.
Autoradiogram of brain section images for the different treatment groups. (A) GSK-3 inhibitor alone with wild type mice (n = 3); (B) FUS sonication alone with transgenic mice (n = 6); (C) GSK-3 inhibitor with transgenic mice (n = 6); (D) combination of GSK-3 inhibitor and FUS with transgenic mice (n = 9); and quantification of 4 groups with (E) cortex (F) hippocampus. AR-alone and FUS-alone groups didn’t show plaque differences when analyzing cortex and hippocampus regions. However, the plaque-reduction effect could be revealed in AR + FUS group as measured in cortex (31.5% reduction; 3099.9 ± 311.6 LAU/mm2 vs. 4526.2 ± 574.9 LAU/mm2; p = 0.0401) or hippocampus (25.6% reduction; 1248.1 ± 136.9 LAU/mm2 vs. 1678.1 ± 207.1 LAU/mm2; p = 0.0159). WT = wild type; AR = AR-A014418; FUS = focused ultrasound.

