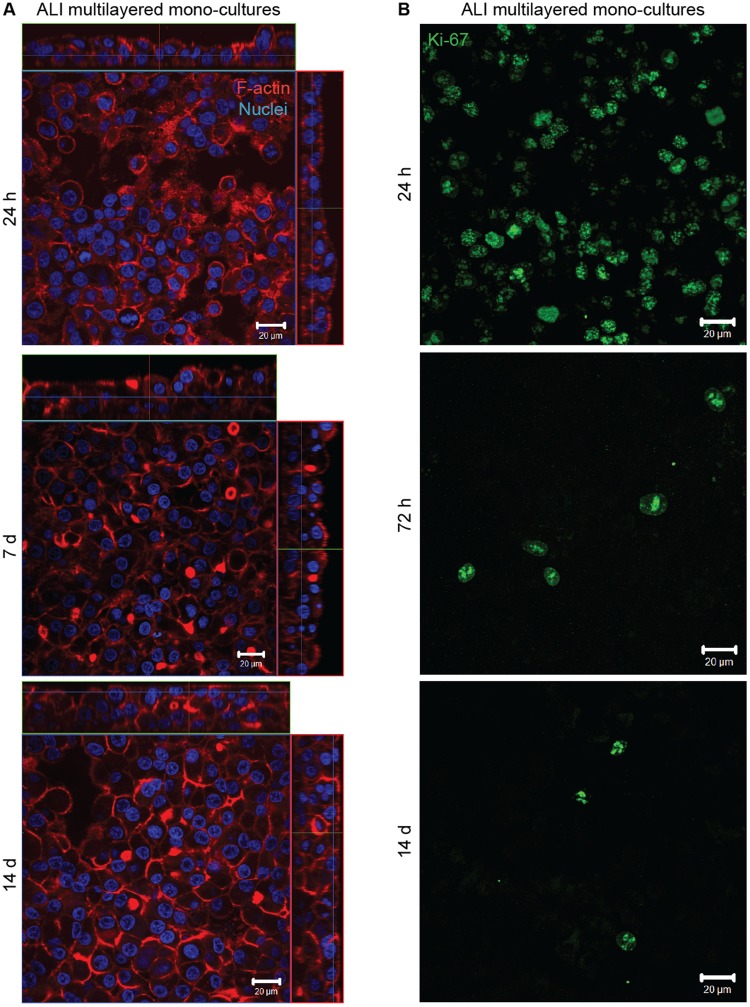
Figure 2.
Properties of ALI MCCs: Representative LSCM images of the (A) F-actin organization (in red) and (B) Ki67 protein expression (in green) in ALI multilayered mono-cultures at different time-points. Full datasets for all time-points are reported in the Supporting Information. Scale bars: 20 μm (objective lens: 63×). (A) Cell nuclei were also stained with Hoechst 33342 (in blue). Z-stack images, here presented in orthogonal view, clearly demonstrate the multilayered structure of the in vitro models developed. (B) Z-stack images of the apical side of the cultures were reconstructed and are shown as three-dimensional projections.

