Figure 4.
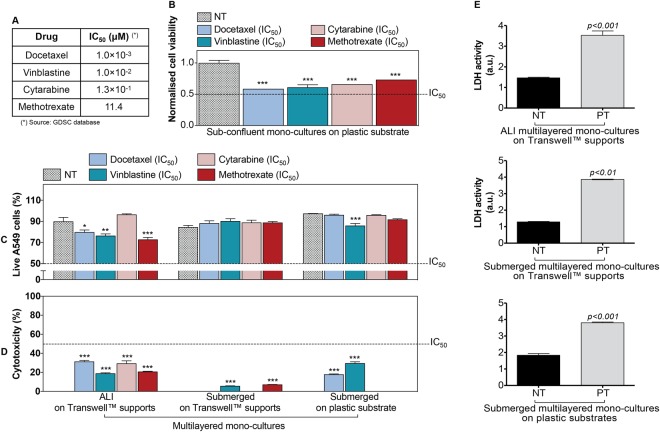
Cell culture architecture influences the response to anti-cancer drugs administered by direct inoculation: (A) Details of the four anti-cancer drugs tested in this study. Their half-maximal inhibitory concentration (IC50) is listed as reported in the GDSC database for the A549 cell model (in the text referred to as “nominal IC50”). (B) Changes in cell viability of sub-confluent mono-cultures of A549 cells grown on plastic substrates and exposed to the four anti-cancer drugs at their nominal IC50 concentration for 72 h. GDSC database experimental conditions were reproduced in our assay. Data, shown as average ± standard error of the mean (nreplicates = 3; ntests = 3), are normalized to the cell viability of the untreated control (NT). The symbol (***) indicates statistically significant differences from NT (p < 0.001) (one-way ANOVA followed by Dunnett post-test). (C,D) Percentage (%) of live A549 cells (C) and % cytotoxicity (D) detected in MCCs cultured for 14 d (from left to right) either on TranswellTM supports (in ALI or in submerged conditions) or on plastic substrates (in submerged conditions) and then exposed to four anti-cancer drugs at their nominal IC50 concentration for 72 h. Data are reported as average ± standard error of the mean (nreplicates = 2; ntests = 3). The symbols (*), (**) and (***) represent significant differences from the corresponding NT (p values < 0.05, 0.01 and 0.001, respectively) (two-way ANOVA and Bonferroni post-test). (E) Histograms of the LDH activity in the experimental controls: untreated mono-cultures (NT) and positive controls (PT). A significant LDH activity was detected in supernatants harvested from PT. Data are reported as average ± standard error of the mean (nreplicates = 3; ntests = 3). p < 0.01 and p < 0.001 indicate a significant difference from NT (t-test).

