Figure 7.
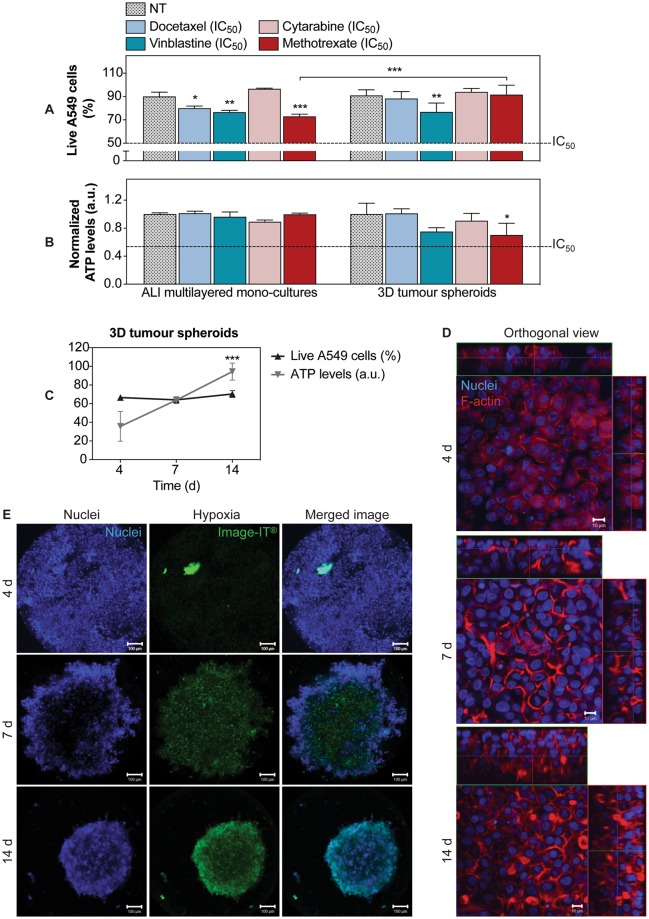
Comparison of the chemoresistance detected in ALI multilayered mono-cultures and 3D tumour spheroids: (A,B) Percentage (%) of live A549 cells (A) and ATP levels (B) detected in (from left to right) ALI multilayered mono-cultures and 3D tumour spheroids. Both in vitro models were grown for 14 d and then exposed to four anti-cancer drugs (docetaxel, cytarabine, vinblastine and methotrexate) at their nominal IC50 concentration for 72 h. Cell cultures were exposed to drugs by direct inoculation. Data are reported as average ± standard error of the mean (nreplicates = 2; ntests = 3). The symbols (*), (**) and (***) indicate significant differences (p values < 0.05, 0.01 and 0.001, respectively) (two-way ANOVA and Bonferroni post-test). (C) Changes in cell viability in 3D tumour spheroids cultured for 4, 7 and 14 d and analysed for their percentage of live cells (in black) and total ATP levels (in grey). Data are shown as average ± standard error of the mean (nreplicates = 2; ntests = 3). The symbol (***) indicates a significant difference from values at t = 4 d (one-way ANOVA and Dunnett post-test). (D) Representative LSCM images of the F-actin organization (in red) in 3D tumour spheroids at different time-points. Cell nuclei were also stained with Hoechst 33342 (in blue). Z-stack images, here presented in orthogonal view, clearly demonstrate the growing thickness of the spheroids overtime. Scale bars: 10 μm (objective lens: 63×). (E) Live 3D tumour spheroids stained for cell nuclei (in blue) and hypoxia (in green) at different time-points. Z-stack images of the cultures were reconstructed and are shown as three-dimensional projections. Scale bars: 100 μm (objective lens: 10×).

