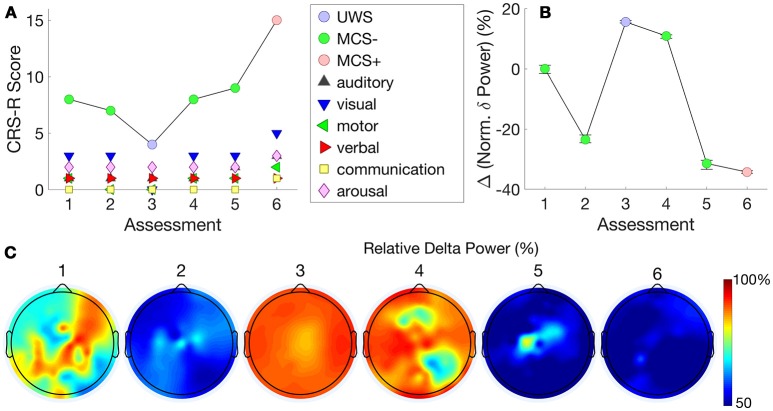
Figure 4.
Patient 3 (MCS- to MCS+) - The trajectory of CRS-R scores (A) is juxtaposed with normalized delta power, averaged over all channels (B). The relationship between these measures indicates that changes in CRS-R scores were inversely associated with delta power. (C) plots normalized delta power topography at each assessment.

