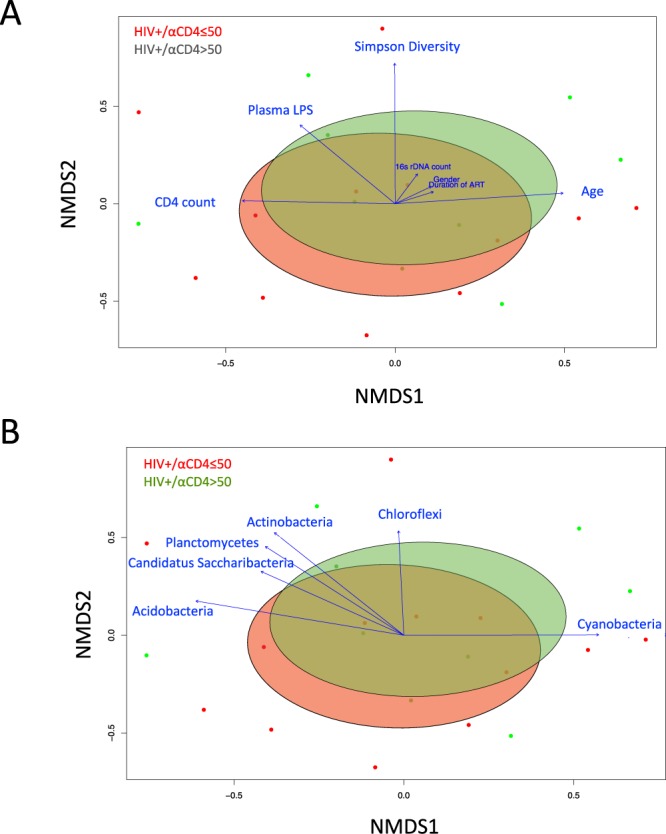
Figure 4.

Nonmetric multidimensional scaling ordination (NMDS) plot of the OTUs with fitted vectors of clinical variables (A), and based on the abundance of bacterial phyla (B). Dots with different colors represent data from each plasma sample in HIV+ subjects with anti-IgG level ≤ 50 ng/mL (red) and HIV+ subjects with anti-CD4 IgG > 50 ng/mL (green). Ellipses denote the standard deviation of the weighted average NDMS score of anti-IgG level ≤ 50 ng/mL group (red) and anti-CD4 IgG > 50 ng/mL group (green). Community differences were verified by PERMONOVA test (Adonis, P < 0.05). Arrows represent the direction and magnitude of correlation of each clinical variable (A) and the abundance of bacterial phyla (B) with the ordination axes.
