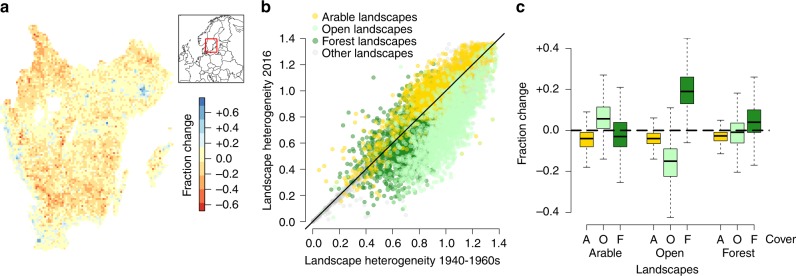
Fig. 1.
Landscape change in southern Sweden between 1940–1960s and 2016. a The extent of decline in open land in 6733 landscapes in the study region. b Comparison of historical and present-day landscape heterogeneity in all 6733 landscapes, with arable, open and forest landscapes defined as the top 25% 5 × 5 km grid squares with the highest cover of those categories in the historical maps (n = 1683). Black solid line at 1:1 between historical and present-day heterogeneity. c Change in cover of arable (yellow), open (light green) and forest (dark green) in arable, open and forest landscapes, showing median, interquartile range and range excluding outliers (defined as quartiles ± (1.5 × the interquartile range))

