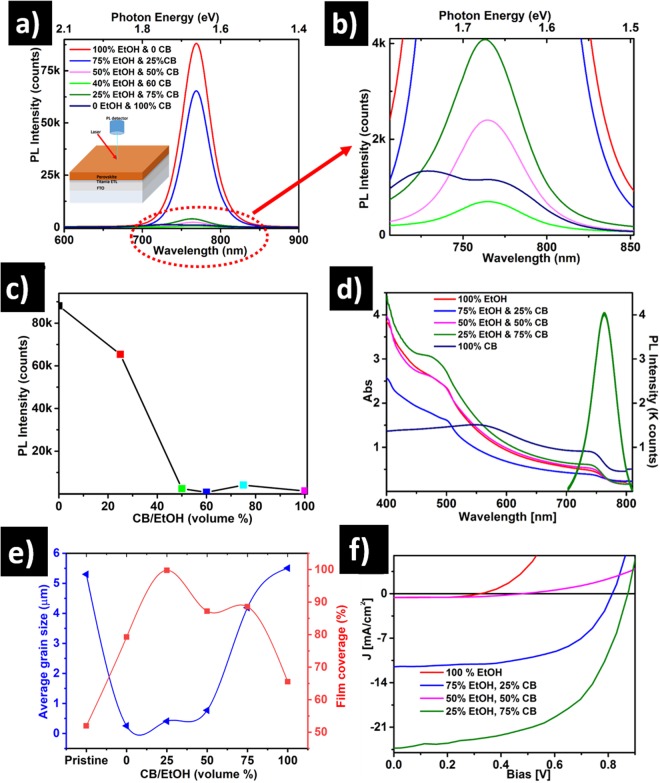
Figure 3.
(a,b) Photoluminescence of perovskite films treated with different mixtures of CB and EtOH. The inset in (a) depicts the device architecture used for PL measurements. (c) Photoluminescence emission intensity evolution for different solvent treatments. Note: the colored squares in (c) match the photoluminescence spectra lines in (a) and (b). (d) UV-Vis absorption spectra after different solvent treatments and photoluminescence of the optimal CB:EtOH = 3:1 treated sample. (e) Statistical analysis of the surface coverage calculated from the SEM images of the treated thin films. (f) PV performances for PSC devices using various CB:EtOH solvent treatments.

