Fig. 1.
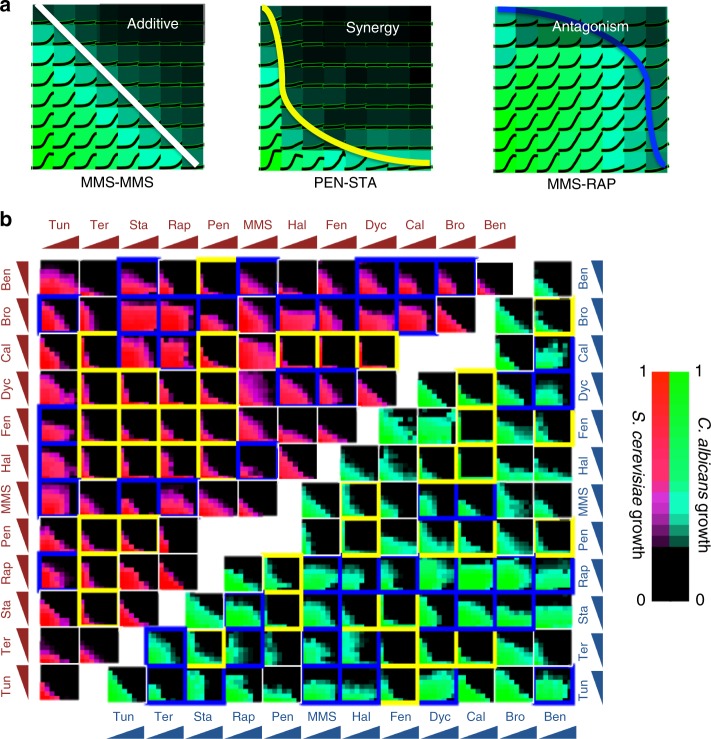
Drug-interaction screen results in C. albicans and S. cerevisiae. a Classification of drug interactions. Yeast cells were grown in a 2D grid with linearly increasing concentrations of one drug on each axis. Representative experiments on C. albicans with growth curves are shown on a heat map for growth. Drug interactions are assessed based on the concavity of isophenotypic contours. On the left, a “self–self” experiment is shown, wherein MMS is increased on each axis. Such pairs are defined as additive and have linear isophenotypic contours. Drug pairs with concave (PEN-STA) or convex (MMS-RAP) contours are defined as synergistic or antagonistic, respectively. b Drug-interaction experiments among all pairwise combinations of 12 drugs in C. albicans and S. cerevisiae. Each subplot shows the growth level for each drug-concentration combination for C. albicans (green/teal) and S. cerevisiae (red/magenta). Synergistic or antagonistic drug pairs are shown in yellow or blue boxes, respectively. Eight S. cerevisiae experiments were newly conducted for this study: MMS tested against MMS, BRO, CAL, DYC, FEN, HAL, RAP, and TUN. Other experimental data involving S. cerevisiae were obtained from Cokol et al., 2011

