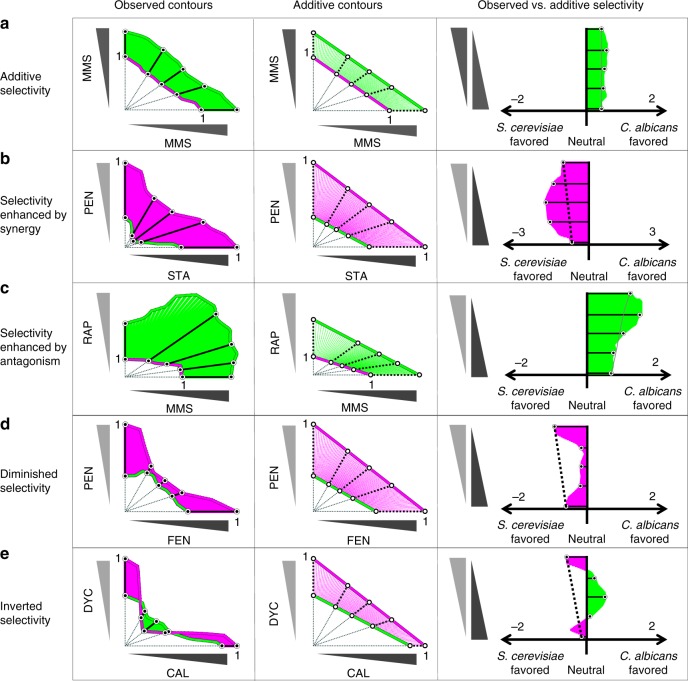
Fig. 3.
Drug interactions may enhance, diminish or invert selectivity. Left panel: Observed isophenotypic contours of drug-interaction assays for S. cerevisiae (magenta) and C. albicans (green) are overlaid in a 2D grid adjusted for relative concentration. We linearly transformed the isophenotypic contours for drug-interaction assays so that S. cerevisiae’s isophenotypic contour intercepted both x and y axes at 1. Selectivity of a combination was determined by the log ratio of the distance from the origin to the C. albicans vs. S. cerevisiae contours (log2(dalbicans/dcerevisiae)). Selectivity is therefore positive for drugs or combinations that select for C. albicans. Middle panel: the middle panel demonstrates the null model for expected combination selectivity, assuming drug pairs are additive. As in observed selectivity, expected selectivity is calculated based on the log ratio of distances from the origin with positive expected selectivity corresponding to an expected selectivity for C. albicans, in the absence of synergistic or antagonistic drug interactions. Right panel: observed (solid) and expected selectivity (dashed line) scores are overlaid. Green- or magenta- shaded regions represent observed C. albicans or S. cerevisiae selectivity. Deviations from expected selectivity indicates a change in selectivity due to drug interactions. Five representative drug pairs are shown with expected (additive) selectivity (a MMS + MMS), enhanced selectivity (b pentamidine and staurosporine and c MMS and rapamycin), diminished selectivity (d fenpropimorph and pentamidine), and inverted selectivity (e calyculin A and dyclonine), compared to single-agent expected selectivity

