Fig. 5.
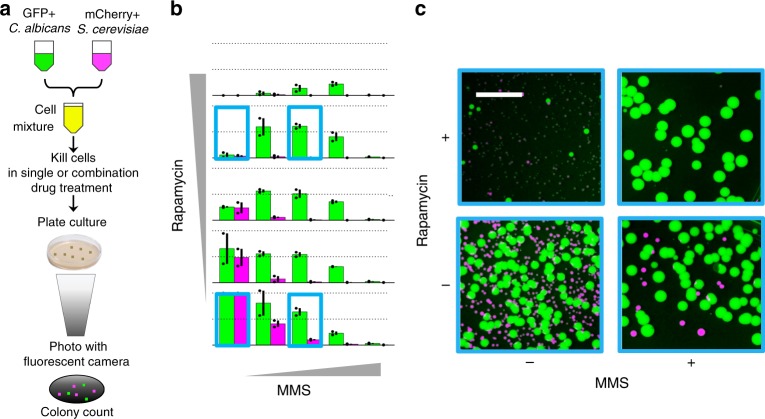
Multiplexed fungicidal drug-interaction assay illustrates selectivity increase via antagonism. a mCherry expressing S. cerevisiae and GFP expressing C. albicans cells were co-cultured in 2D grids of drug combinations in liquid media and transferred to YPD-agar plates. After 48-hour incubation, plates were photographed and cells enumerated with ImageJ software. b Bar charts of size proportional to cell number compared to the no drug control and color representative of species (green: C. albicans, magenta: S. cerevisiae) are shown for each MMS-rapamycin combination tested. For each subplot, the top dashed line represents CFUs equal to those observed for the no drug control and the second dashed line represents half the CFUs relative to those observed for the control. Error bars represent ± S.E.M. of two independent experiment results, overlaid on the bar charts as dots (n = 2). The experiments indicated with boxes correspond to four representative images of colonies post-incubation in variable drug conditions shown in c. c While rapamycin and MMS are both toxic for these two yeast species, a low MMS-high rapamycin combination selects for the survival of C. albicans. The gray line is 15 mm, all images are of the same size/scale

