
FIGURE 1.
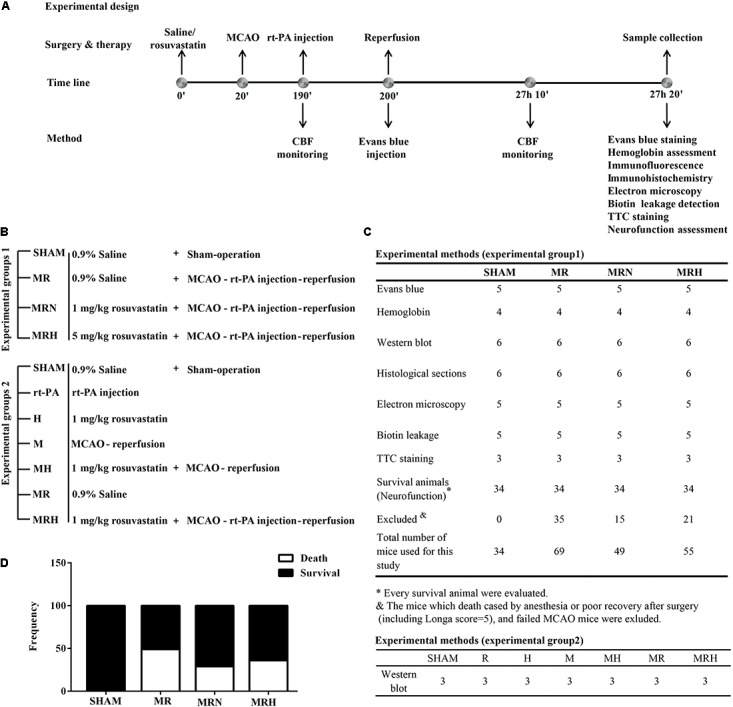
Schematic overview of the protocols. (A) Illustration of the protocols, including the time line of the experiments and tests. (B) The treatment groups of experiments 1 and 2. (C) The tests and numbers of mice in experiments 1 and 2. (D) The frequencies of death and survival in mice, which were analyzed by chi-square test.