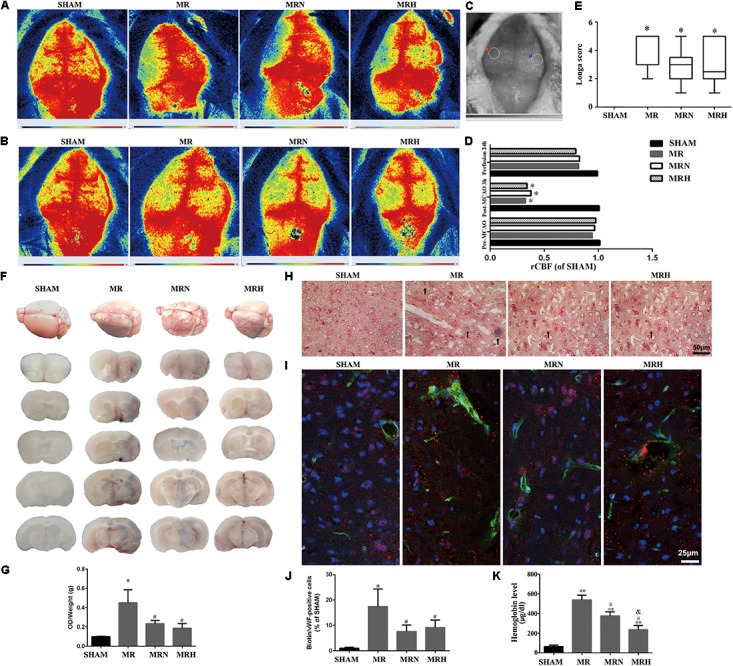
FIGURE 2.

Rosuvastatin decreased BBB permeability at 24 h following rt-PA reperfusion after brain ischemia but did not alter cerebral blood reflow. (A) Representative images of CBF before reperfusion in SHAM, MR, MRN and MRH groups captured by 2-D laser speckle imaging. (B) Representative images of CBF after 24 h reperfusion in SHAM, MR, MRN, and MRH groups captured by 2-D laser speckle imaging. (C) Circles indicate the monitored areas. (D) The rCBF results were expressed as fold changes of the ROI ratio to the right side (rCBF), n = 6. ∗P < 0.05 compared to the corresponding SHAM value. (E) Neurological deficits were evaluated in a blinded manner by determining the Longa score before MCAO and at 24 h after reperfusion in the SHAM group, mice that underwent MCAO for 3 h followed by rt-PA reperfusion for 24 h (MR), mice pretreated with a normal dose of rosuvastatin (1 mg/kg) prior to MCAO for 3 h followed by rt-PA reperfusion for 24 h (MRN), and mice pretreated with a high dose of rosuvastatin (5 mg/kg) prior to MCAO for 3 h followed by rt-PA reperfusion for 24 h (MRH) groups. The Kruskal–Wallis test and Wilcoxon non-parametric test were used to compare the mean infarct volumes among the groups at a significance level of 0.05. (F) Representative whole-brain and coronal sections of mouse brains after a MCAO and after 24 h reperfusion. The dark blue color indicates clusters of bleeding areas stained by Evans blue. Data are presented as the means + SEM, n = 5; ∗P < 0.05 compared to SHAM, #P < 0.05 compared to MR. (G) The levels of Evans blue leakage in the brain were quantified spectrophotometrically in the supernatant at 620 nm and normalized to hemispheric weights (OD/μg). (H) Perls’ iron staining was used to visualize microvascular hemorrhages. The dark blue area indicated by a black arrow is associated with a hemorrhage. Scale bar, 50 μm. (I) Representative images showing the Sulfo-NHS-Biotin tracer extravasation assay. The leakage of biotins (green) from vessels is shown (red staining represents vWF-positive cells). Scale bar = 25 μm. (J) Quantitative analysis of the percentage of biotin/vWF-positive cells normalized to the SHAM group. Data are presented as the means + SEM, n = 5; ∗P < 0.05 compared to SHAM, #P < 0.05 compared to MR. (K) Quantitative analysis of intracerebral hemorrhages using a hemoglobin assay. Data are presented as the means + SEM, n = 4; ∗∗P < 0.01 compared to SHAM, #P < 0.05 compared to MR, &P < 0.05 compared to MRN.
