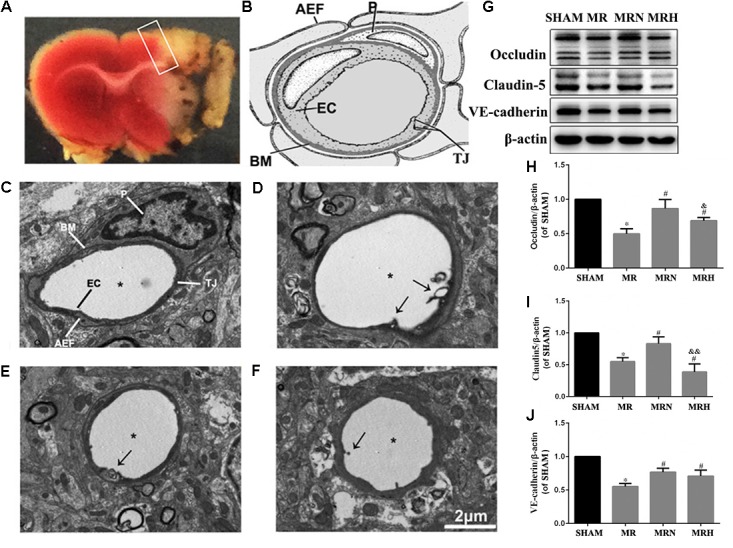
FIGURE 3.

Rosuvastatin upregulated the levels of TJs and AJs in the peri-infarct region following reperfusion. (A) Representative coronal sections stained by TTC following MCAO and after 24 h reperfusion. The white color indicates the infarct region, which was observed as a pale color with the naked eye, and the white box indicates the peri-infarct region being observed. (B) General view of neurovascular unit is presented; P indicates pericyte, EC indicates endothelial cell, AEF indicates astrocytic end-feet, TJ indicates tight junction. The images were visualized using TEM at a magnification of 6000× (scale bar = 2 μm). (C) Transmission electron micrographs show the normal ultrastructure of the BBB in the cerebral peri-infarct area, which is labeled similarly to the general view of a neurovascular unit seen in (B). (D) Transmission electron micrographs show the abnormal ultrastructure of the BBB in the cerebral peri-infarct area of MR mice. Stars indicate the microvessel lumen, and arrows indicate broken TJs. (E,F) show the abnormal ultrastructure of the BBB in the cerebral peri-infarct areas of MRN and MRH mice under TEM, respectively. Stars indicate the microvessel lumen, and the arrows indicated broken TJs. (G) The bands for the occludin, claudin-5, VE-cadherin, and β-actin proteins were detected by Western blotting. (H–J) The relative densities were assessed by calculating the ratios of the occludin, claudin-5 and VE-cadherin proteins to β-actin and compared with those of the SHAM group (∗P < 0.05), among the MRN, MRH, and MR groups (#P < 0.05), and between the MRN and MRH groups (&P < 0.05, &&P < 0.01). Means ± SEM, n = 6.
