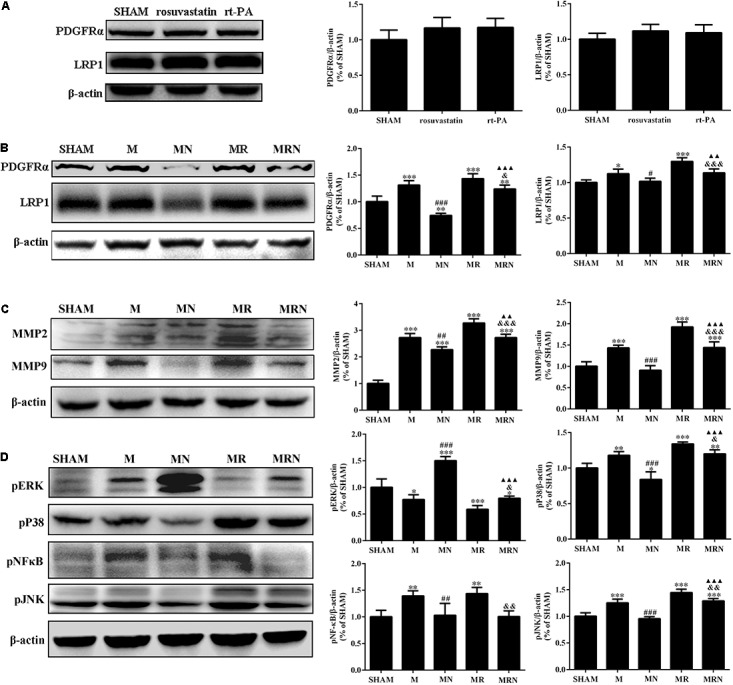
FIGURE 6.

The rosuvastatin-mediated reduction in BBB damage induced by rt-PA reperfusion after MCAO was associated with MAPK pathways. (A) The bands for the PDGFR-α, LRP-1, and β-actin proteins in the SHAM, 1 mg/kg rosuvastatin-alone treatment (rosuvastatin), and rt-PA-alone treatment (rt-PA) groups determined by Western blotting. The relative densities were assessed by calculating the ratios of the PDGFR-α and LRP-1 proteins to β-actin and comparing the differences with the SHAM group, P > 0.05. Means ± SEM, n = 3. (B) The bands for the PDGFR-α, LRP-1, and β-actin proteins in the SHAM group, mice that underwent MCAO for 3 h followed by reperfusion for 24 h (M), mice receiving a high dose of rosuvastatin prior to MCAO for 3 h followed by reperfusion for 24 h (MN), mice that underwent MCAO for 3 h followed by rt-PA reperfusion for 24 h (MR), and mice pretreated with a high dose of rosuvastatin prior to MCAO for 3 h followed by rt-PA reperfusion for 24 h (MRN) were determined by Western blotting. The relative densities were assessed by calculating the ratios of the PDGFR-α and LRP-1 proteins to β-actin and comparing the differences with the SHAM group (∗P < 0.05, ∗∗P < 0.01, ∗∗∗P < 0.001), the M group (#P < 0.05, ###P < 0.001), the MR group (&P < 0.05, &&&P < 0.001), and the MN group (P < 0.01, P < 0.001). Means ± SEM, n = 3. (C) The bands for the MMP2, MMP9, and β-actin proteins were detected by Western blotting of samples from the SHAM, M, MN, MR, and MRN groups. The relative densities were assessed by calculating the ratios of the MMP2 and MMP9 proteins to β-actin and comparing the differences with the SHAM group (∗∗∗P < 0.001), the M group (##P < 0.01, ###P < 0.001), the MR group (&&&P < 0.001), and the MN group (P < 0.01 and P < 0.001). Means ± SEM, n = 3. (D) The bands for the pERK, pP38, pJNK, pNFκB, and β-actin proteins were detected by Western blotting samples from the SHAM, M, MN, MR, and MRN groups. The relative densities were assessed by calculating the ratios of pERK, pP38, pJNK, and pNFκB proteins to β-actin and comparing the differences with the SHAM group (∗P < 0.05, ∗∗P < 0.01, ∗∗∗P < 0.001), the M group (##P < 0.01, ###P < 0.001), the MR group (&P < 0.05, &&P < 0.01), and the MN group (P < 0.001). Means ± SEM, n = 3.
