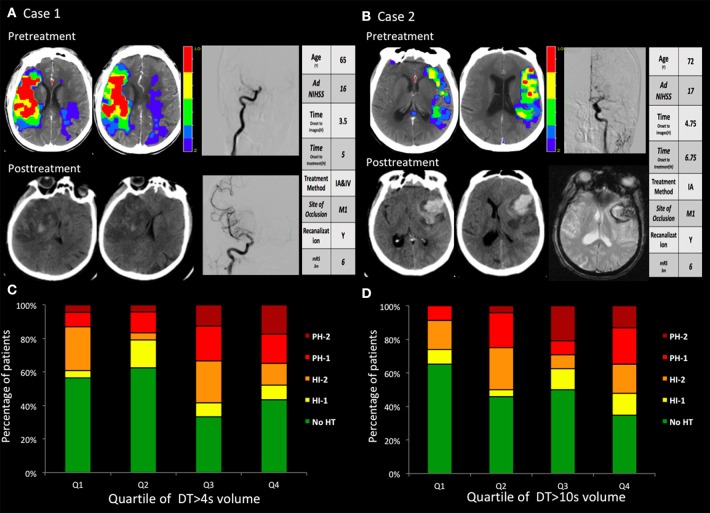
Figure 2.
(A,B) two cases with hemorrhagic transformation. (A) Pretreatment CTP images show a marked large area with perfusion delay. The day after recanalization with intravenous and endovascular treatment, CT findings revealed a PH. The PH was located within the mildly and severely hypoperfused regions. (B) Pretreatment CTP images show small areas with large mild perfusion delay and small severe perfusion delay. After recanalization with endovascular treatment, CT and GRE findings revealed a large area of PH. The PH was located within the mildly hypoperfused regions. (C,D) The volume in the regions with baseline mild and severe perfusion delay (DT >4 s and DT >10 s) correlated with the PH. Q1 represents the patients with the lowest quartile volume, whereas Q4 indicates patients with the highest quartile volume.

