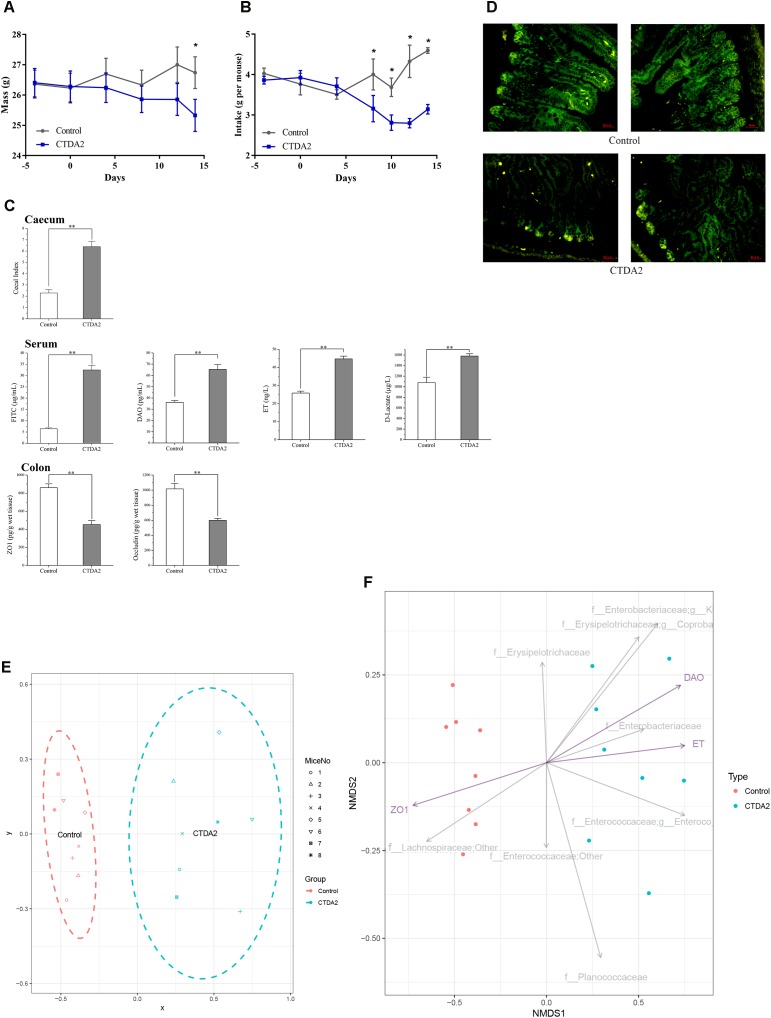
FIGURE 4.
Establishing a CTDA mouse model based on key host biomarkers (A) = weight and (B) = food intake of mice. Day 4 was the first day of the adaptive phase, ampicillin administration started on day 0, and the end point of ampicillin use was day 14. A two-tailed student’s t-test was used to determine statistical significance, ∗P < 0.05. Error bars represent mean ± SEM (n = 8). (C) Main factors including cecal indices in cecum, biomarkers associated with the gut barrier isolated from the serum and expression of tight-junction proteins in the colon of Control and CTDA2 mice. A two-tailed student’s t-test was used to determine statistical significance, ∗∗P < 0.01. Error bars represent mean ± SEM (n = 8). (D) Images representing tight junction disruption (occludin) of the ileum in the Control and CTDA2 groups of mice as determined by immunofluorescence (Representative images, n = 4/group). (E) Non-parametric monotonic relationship between the dissimilarities in the samples of CTDA2 group (blue, right) and Control group (red, left) matrix. The spots site based on the abundance of microbial taxa, measurement of cecal, colon, and serum samples which listed in C. (F) Non-metric multidimensional scaling plot of family and genus compositions for the Control (red) and CTDA2 samples (blue) with the three featured variables (purple arrows) (DAO = diamine oxidase, ET = endotoxin, and ZO1 = tight-junction protein ZO-1) plotted using the EnvFit function of package in R. The gray arrows give the top eight families or genera that most differ in expected proportion. f_Enterobacteriaceae, g_K = f_Enterobacteriaceae, g_Klebsiella, f_Erysipelotrichaceae, g_Coproba = f__Erysipelotrichaceae, g__Coprobacillus, f_Enterococcaceae, g_Enteroco = f_Enterococcaceae, and g_Enterococcus.

