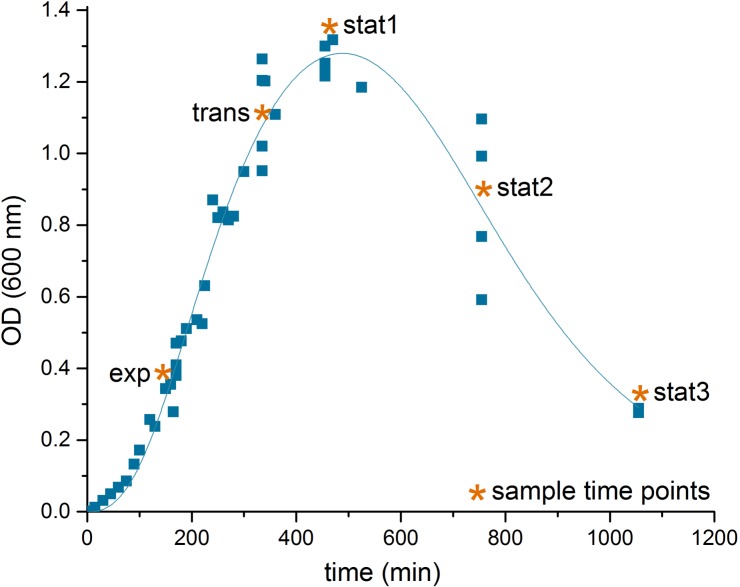
FIGURE 1.
Growth curve of C. difficile 630Δerm. Shown is the growth curve of C. difficile 630Δerm in casamino acids medium of four biological replicates, lag phase corrected, and the sampling time points (∗) in the exponential phase (exp), the transient phase (trans), and three times in the stationary phase (stat1-3). The curve was fitted according to the biphasic Hill Equation using OriginPro, 2016 software (OriginLab Corporation, MA, USA); reduction of the optical density after time point stat1 was induced by aggregation of the cells in the culture medium.

