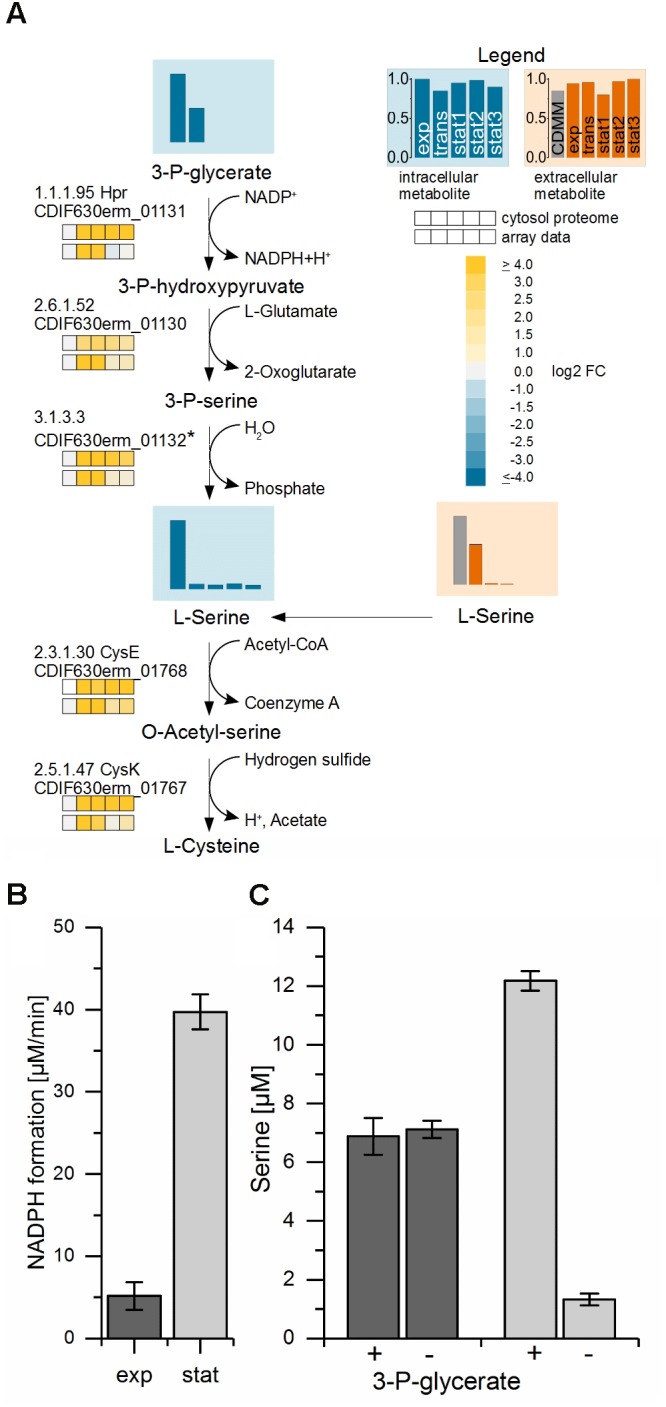
FIGURE 4.

Proposed biosynthesis-pathway of C. difficile from the glycolysis substrate 3-phosphoglycerate to serine and cysteine. (A) Shown is the proposed pathway from 3-phosphoglycerate via serine to cysteine with the detected metabolite levels of 3-phosphoglycerate (3-P-glycerate) and the intracellular and extracellular L-serine values and the corresponding transcriptomic and proteomic data. The bars and the squares point out the sample time points exp, trans, stat1, stat2, and stat3 from left to right. The vertical axis shows the relative abundance based on the highest concentration; blue: intracellular compounds, orange: extracellular compounds, gray bar in exometabolome: initial concentration in the medium. Missing intermediate metabolites were not detected in the GC-MS or LC-MS analysis. The proteomic data of the cytosolic fraction (top squares) and the transcriptomic data (lower squares) show the log2 FC of each time point in comparison with the exponential phase. ∗We proposed CDIF630erm_01132, a protein of unknown function located in the same operon with weak homologies to hydrolases, as a candidate for the generation of serine by the removal of the phosphate. (B) NADPH formation in the enzyme assay of crude extracts from exponential (dark gray) and stationary phase (light gray) performed at 30°C in a photometer. (C) Serine content in the enzyme assay detected in samples of crude extracts from exponential (dark gray) and stationary phase (light gray) analyzed by HPLC with (+) and without (–) the substrate 3-P-glycerate performed at 22°C.
