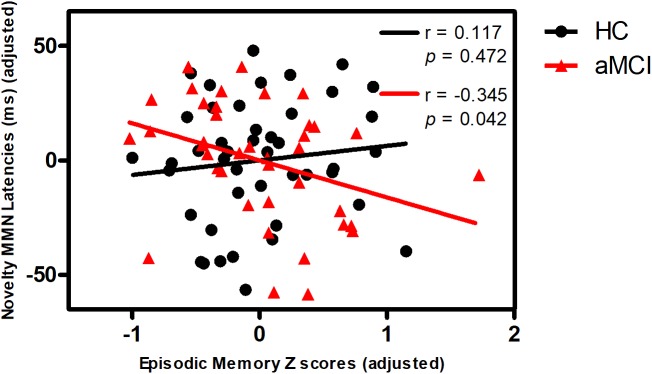
FIGURE 1.
Correlation of novelty MMN latency with episodic memory in aMCI and HC. Scattergram represents correlation between episodic memory Z score (adjusted scores) and novelty MMN latency (adjusted scores) in HC (black line) and aMCI (red line). Note that the data of the latency is mean latency from the Fz, FCz, Cz electrodes. The figure used the adjusted data controlling for the effects of age, gender, education years, ApoE status, and group.

