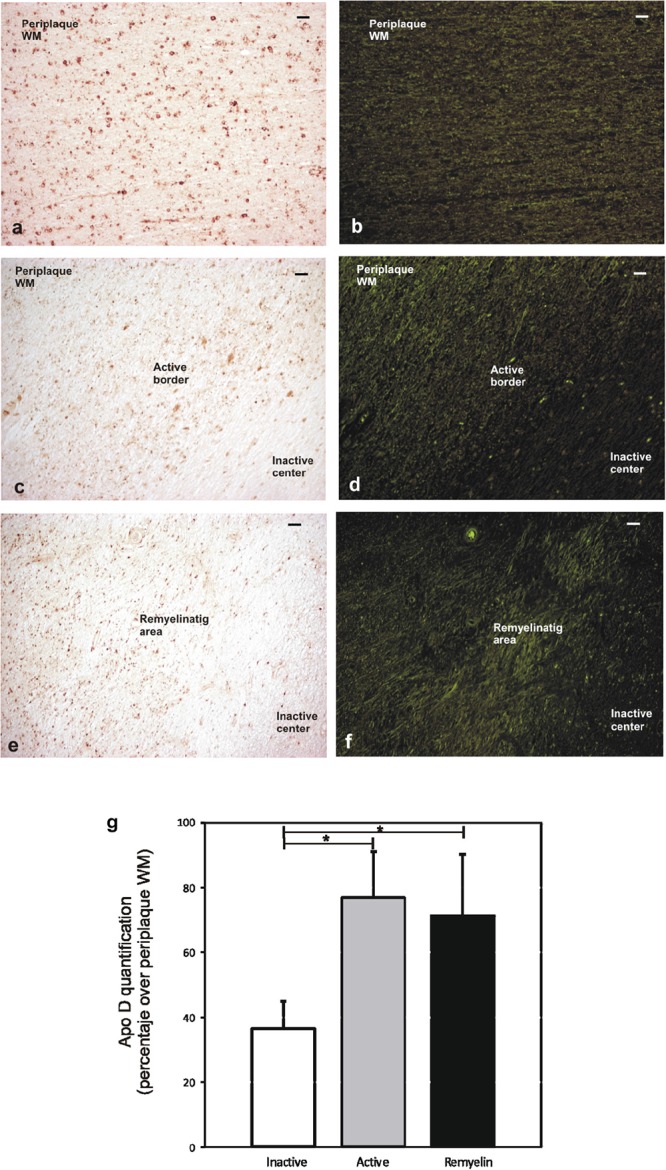
FIGURE 4.

Representative image of remyelination area in a sclerosis plaque. Immunohistochemistry for Apo D visualized under light microscopy (a,c,e), and same area observed with fluorescent microscopy to visualize autofluorescence of myelin sheaths (b,d,f). Scale bar: 50 μm (10×). Histogram showing densitometric quantification of Apo D (g). Bars represent mean density in 20× field ± SEM. ∗Statistically significant differences, p < 0.05. Periplaque WM was taken as 100% of Apo D and the rest of the values relativized to it.
