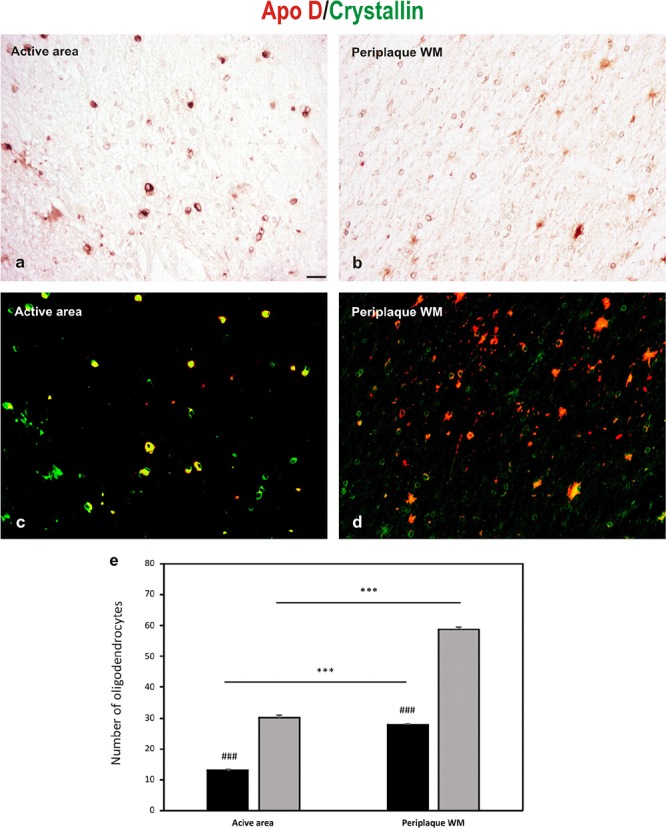
FIGURE 5.

Double immunohistochemical technique for crystallin (DAB signal, brown) and Apo D (Cy3 fluorescence signal, red). (a,b) The bright-field micrographs of crystallin signal (c,d) The digital superposition, on those section, of fluorescence signal for Apo D. Digital superposition shows clearly the absence of Apo D expression in some OLGs (green signal) and OLGs with Apo D expression (yellow signal). Representative image of active plaque area (a,c). Representative image of periplaque WM area (b,d). Scale bar: 20 μm. Histogram showing number of OLGs positive for crystallin (gray bars) and also labeled for Apo D (black bars; colocalization signal) (e). Bars represent OLGs number in 20× field ± SEM. ∗∗∗Statistically significant differences active area versus periplaque WM, p < 0.001. ###Statistically significant differences Apo D versus crystallin, p < 0.001.
