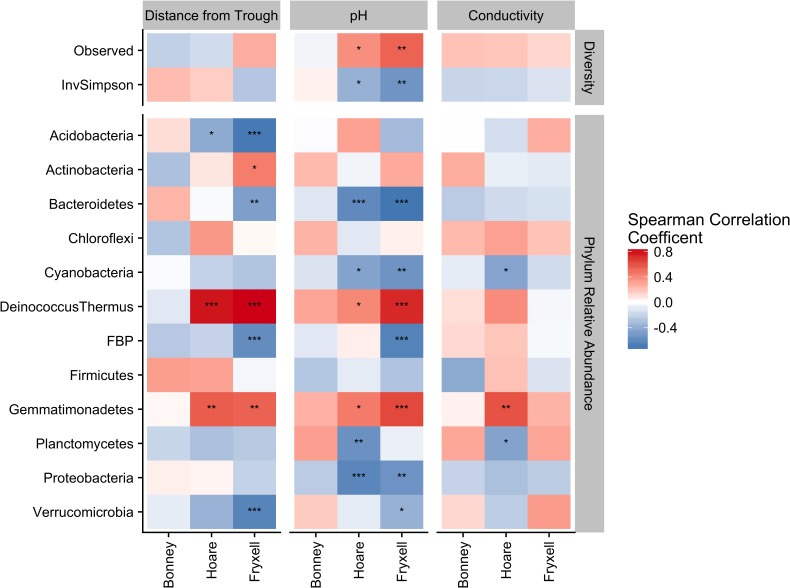
FIGURE 6.
Assessing relative influence of edaphic factors over alpha diversity (top) and major phyla relative abundances (bottom) using Spearman rank correlations, revealing that phyla tend to respond in a similar direction regardless of basin. ∗P ≤ 0.05, ∗∗P ≤ 0.01, ∗∗∗P ≤ 0.001. P-values of distance from trough, pH, and conductivity adjusted for multiple comparison using Benjamini and Hochberg (1995).

