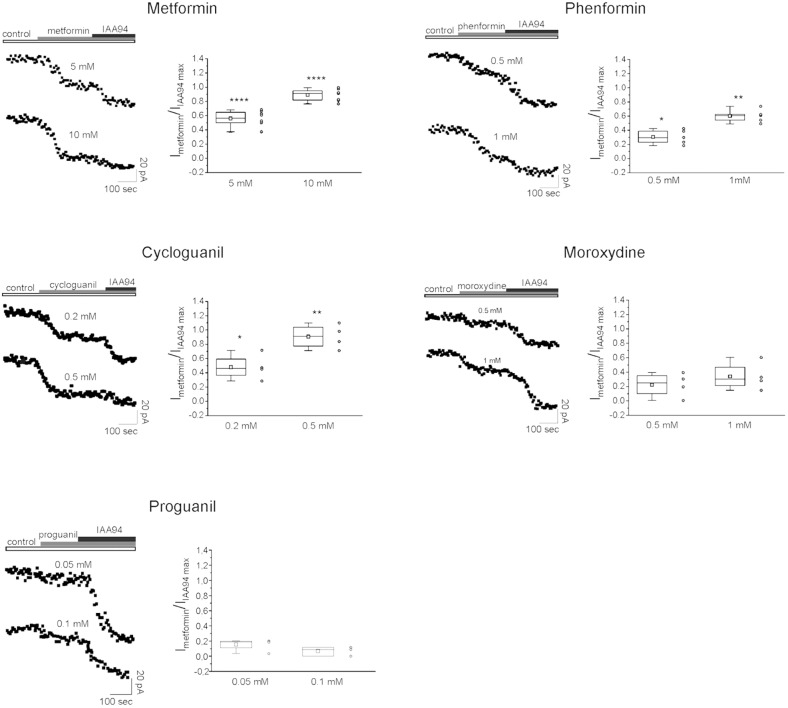
FIGURE 8.
CLIC1 associated membrane current inhibition by biguanide compounds. Membrane current from GBM2 has been elicited by a 100 mV voltage step, from –40 to +60 mV, 800 ms in duration. Stimulus has been delivered every 10 s to generate a current amplitude time course. CLIC1 current inhibition is calculated as ratio of the effect induced by each compound and the inhibition observed after IAA94 (100 μM) treatment that represents the residual CLIC1 activity. For each compound are shown experimental data at two different concentrations reported on the top of each current time course (left). The (right) depict box chart plots showing the average inhibition of CLIC1 current, calculated as ratio between the compound and IAA94 sensitive currents. Number of cells used for the statistics range from 4 to 8 for each compound concentration (empty circles next to box charts). Unpaired t-test: ∗p < 0.05, ∗∗p < 0.01, ∗∗∗∗p < 0.0001 vs. CTR cells.

