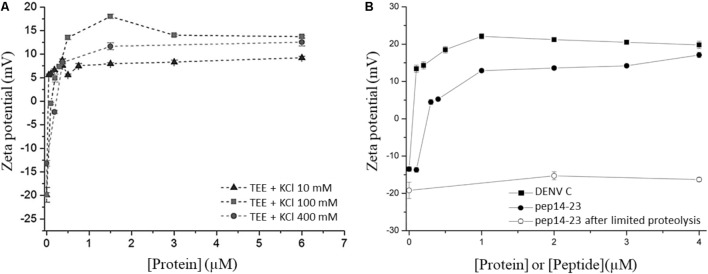
FIGURE 5.
ζ-potential of LDs in different conditions. (A) LDs ζ-potential values determined in the absence and in the presence of distinct DENV C concentrations, at different KCl concentrations (adapted from Carvalho et al., 2012). (B) LDs ζ-potential values determined before (filled symbols) or after limited proteolysis (empty symbol), in the presence of DENV C (squares) or pep14-23 (circles) (adapted from Martins et al., 2012).

