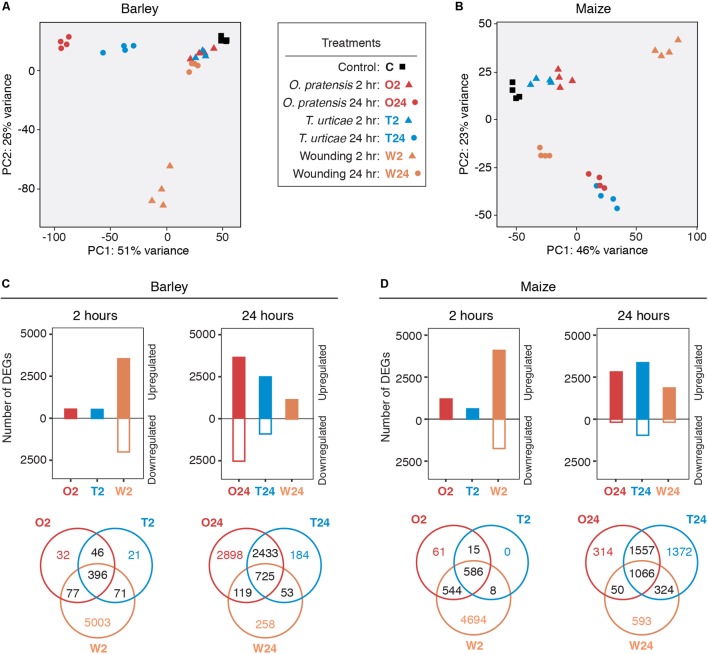
FIGURE 2.
Dynamic gene expression changes in barley and maize in response to mite herbivory and wounding. (A,B) PCAs of expression data for control, mite infested, and wounded leaves in barley and maize, respectively. Treatments and time points are as indicated in the legend (center; hour: hr). (C,D) Number of significantly up- and downregulated genes detected in each treatment for barley and maize, respectively (FDR-adjusted P-value of 0.01, absolute value log2 fold change cutoff of 1). Expression differences are broken out by time points (2 and 24 h, left and right for each plant host), and Venn diagrams show the overlap of DEGs among treatments (bottom).

