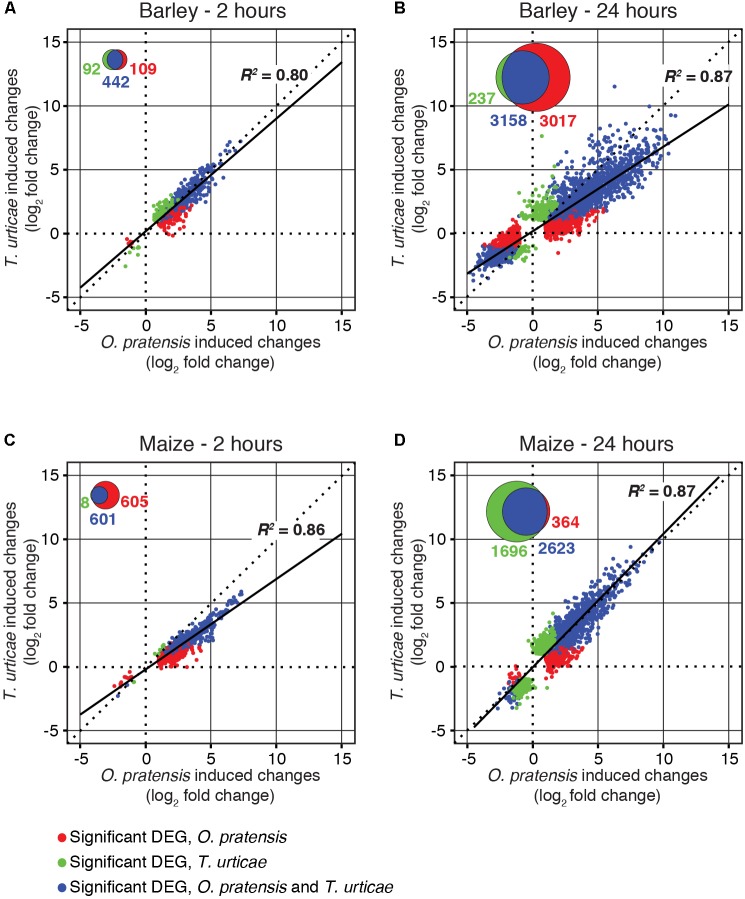
FIGURE 3.
O. pratensis and T. urticae induce similar changes in gene expression in both barley and maize. Scatter plots of log2 fold changes for DEGs (FDR-adjusted P-value of 0.01, absolute value log2 fold change cutoff of 1) in barley (A,B) and maize (C,D) in response to T. urticae and O. pratensis herbivory at two time points (2 h: A,C; 24 h: B,D). For inclusion in a given analysis, a gene had to be detected as differentially expressed in response to at least one herbivore (see Venn diagram insets, and legend, bottom left).

