
FIGURE 4.
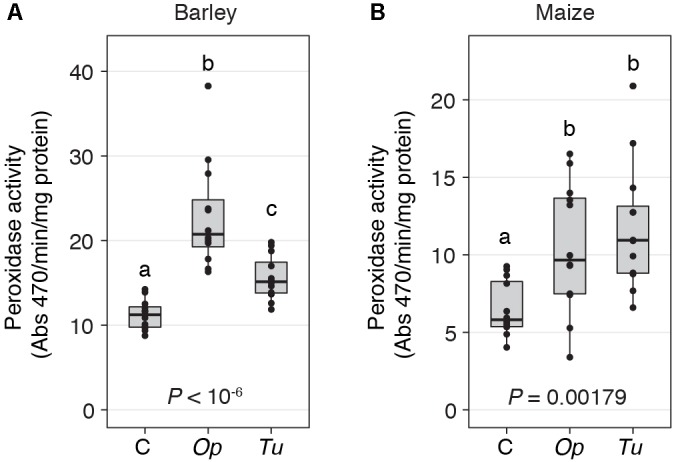
Peroxidase activity increases in response to spider mite herbivory. Peroxidase activity in response to O. pratensis (Op) and T. urticae (Tu) herbivory at 24 h in barley (A) and maize (B). P-values are from an ANOVA, and different letters reflect significant differences among controls (C) and the treatments (P < 0.05, Tukey’s HSD test). In the boxplots, circles represent individual data points.