FIGURE 5.
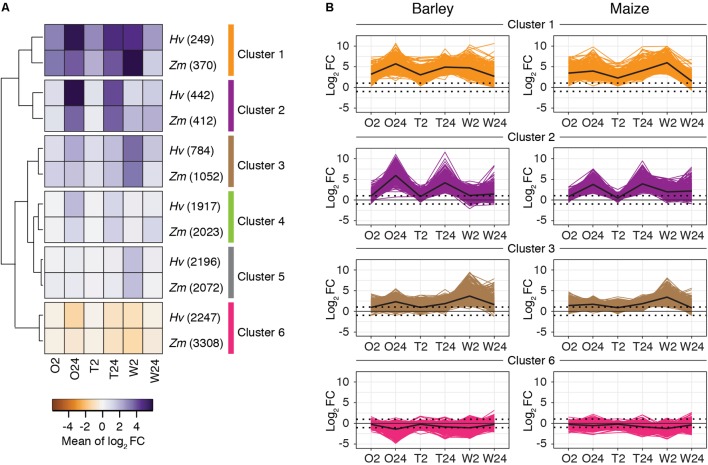
Global patterns of gene expression in response to spider mite herbivory and wounding are similar between barley and maize. (A) By plant host, k-means clusters (k = 6) for DEGs (FDR-adjusted P-value of 0.01, absolute value log2 fold change cutoff of 1) between treatments and controls (gene numbers in clusters are given in parentheses). For inclusion in the analysis for either barley or maize, a gene had to be significantly differentially expressed in at least one treatment relative to the respective control. Shown is a hierarchical clustering of the barley and maize clusters based on the mean expression values of each cluster. (B) Gene expression profiles for barley and maize genes in clusters 1, 2, 3, and 6 as indicated (for clusters 4 and 5, see Supplementary Figure 6). Lines reflect expression changes (log2 fold change relative to controls) for individual genes across treatments. The mean changes of expression by cluster are shown with black lines. Hv, Hordeum vulgare (barley); Zm, Zea mays (maize); O2 and O24, O. pratensis herbivory at 2 and 24 h; T2 and T24, T. urticae herbivory at 2 and 24 h; and W2 and W24, wounding at 2 and 24 h.

