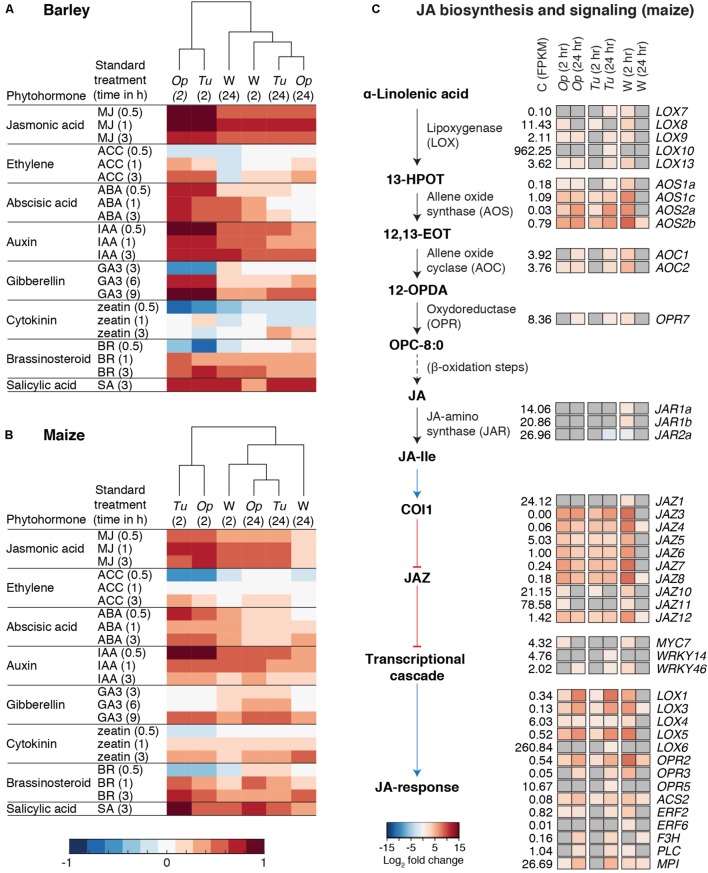
FIGURE 6.
Phytohormone responses to spider mite herbivory and wounding. (A,B) Hormonometer analyses for plant hormone signatures based on transcriptomic responses of barley (A) and maize (B) to O. pratensis (Op) and T. urticae (Tu) herbivory as well as wounding (W) at 2 and 24 hours (hr) as indicated in parentheses. The colors indicate similarity between the herbivory/wounding treatments and a particular hormone response (blue and red for negative and positive correlations, respectively, see bottom). MJ: methyl jasmonate; ACC: 1-aminocyclopropane-1-carboxylic acid (a precursor of ethylene); ABA: abscisic acid; IAA: indole-3-acetic acid; GA3: gibberellin A3; BR: brassinosteroid; and SA: salicylic acid. (C) Schematic of the JA biosynthesis and signaling pathway after Borrego and Kolomiets (2016) (left) with heat maps of log2 fold changes for DEGs, right (FDR adjusted P-value of 0.01, absolute value log2 fold change cutoff of 1). Upregulation or downregulation of marker genes for JA signaling is given in red and blue, respectively, see bottom, for treatments as compared to the control (only genes differentially regulated in at least one contrast are shown). The mean expression level of each gene among control replicates, as assessed by FPKM values, is as indicated (C, control). Where no differential expression was observed for a given gene and treatment, cells are shaded gray. Black arrows indicate chemical transformations (solid: one reaction; dashed: multiple reactions) and blue and red arrows indicate signal transduction (activation and inhibition, respectively).

