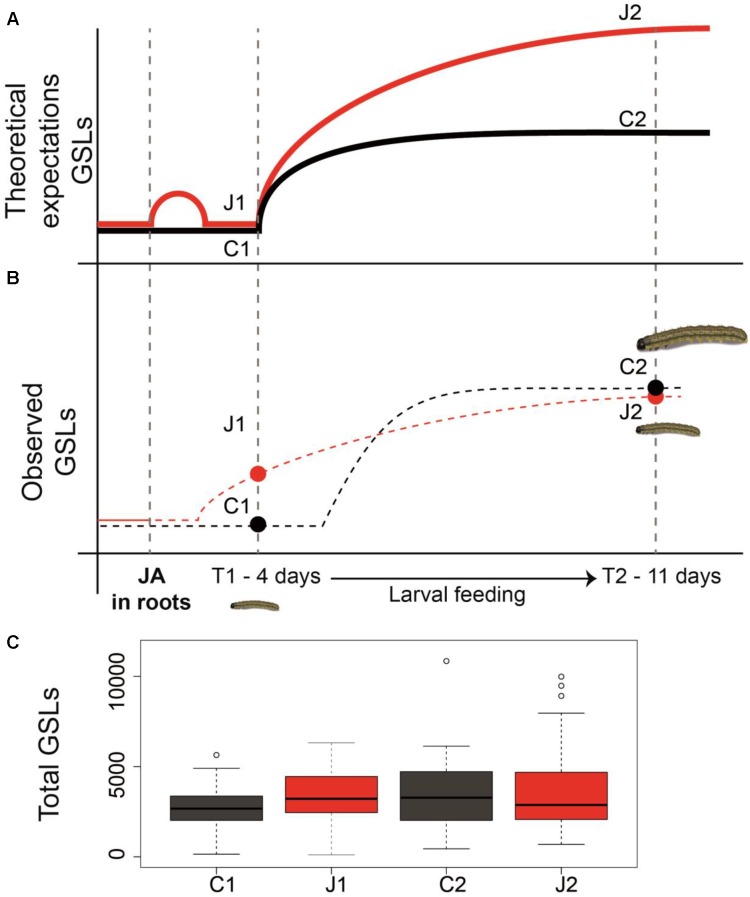
FIGURE 4.
Priming of defenses and resistance in plants. Panel (A) is showing the theoretical expectations of defense priming in plants based on the literature. Panel (B) shows the conceptual model of priming that was observed in this paper as well as the resistance bioassay with Spodoptera littoralis caterpillars. Dots represent the observed values of total GSL sampled at two time points. The dotted lines represent hypothetical GSL induction dynamics. Panel (C) shows how total glucosinolates levels (ng mg-1 FW) vary across time and based on the two treatments of JA induction in the roots (J1 and J2), and no JA induction (C1 and C2).

