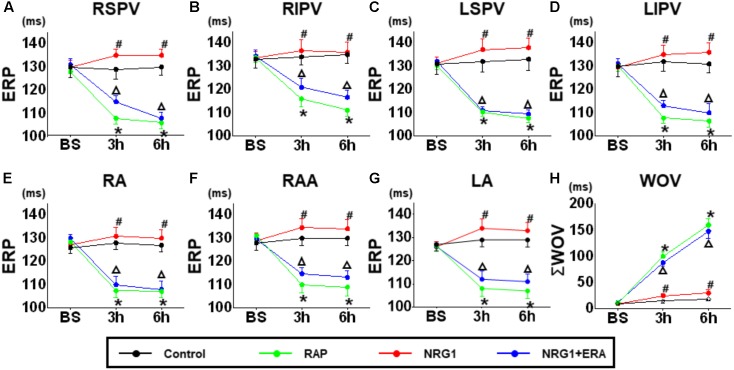
FIGURE 2.
Changes in ERP and ΣWOV. (A–G) The ERP changes at different time points in the control group, RAP group, NRG1 group and NRG1 + ERA group. (H) The ΣWOV changes at different time points in the four groups. The ERP was shortened, and ΣWOV was widened in atrial and pulmonary vein sites in the RAP group. NRG1 alleviated the effect of RAP, and ERA blocked the beneficial effects of NRG1 on ERP and ΣWOV. ∗p < 0.05 vs. NRG1 group. #p < 0.05 vs. RAP group. ΔP < 0.05 vs. the NRG1 group.

