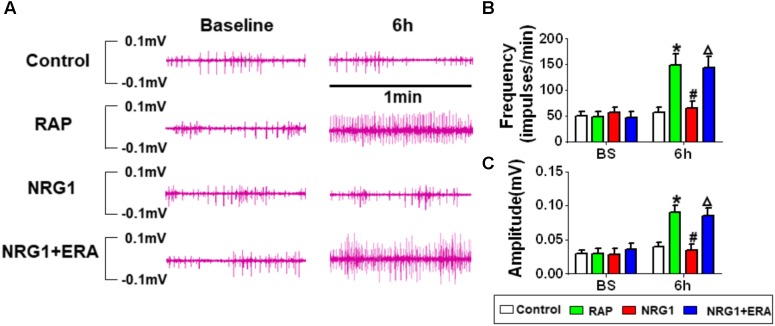
FIGURE 4.
Changes in ARGP neural activity. (A) Representative ARGP neural activity in the control, RAP group, NRG1 group and NRG1 + ERA group. (B) Quantitative analysis of the frequency of ARGP neural spikes. (C) Quantitative analysis of the amplitude of ARGP neural spikes. ∗P < 0.05 vs. the control group; #P < 0.05 vs. the RAP group; ΔP < 0.05 vs. the NRG1 group.

