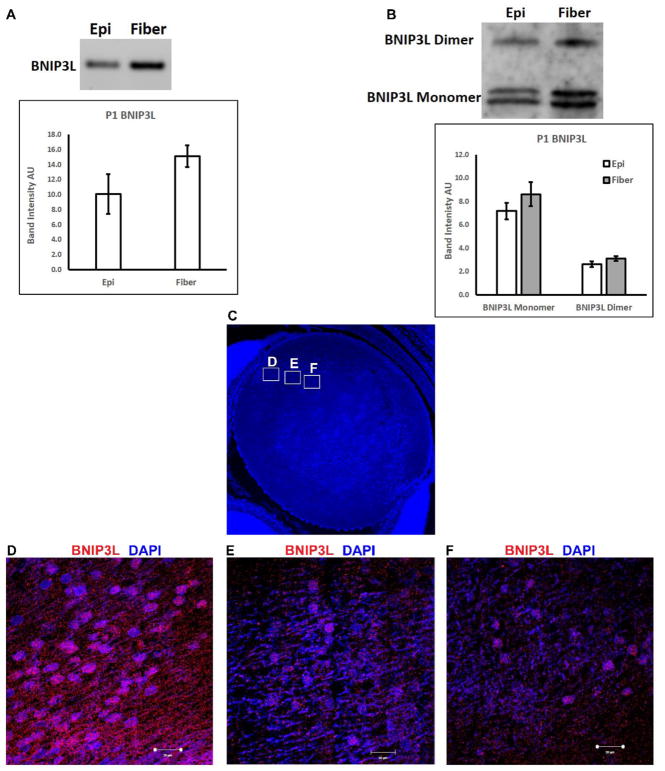
Figure 1. Spatial expression pattern of BNIP3L in wild-type P1 mouse lenses.
A. Ethidium bromide stained agarose gel showing BNIP3L transcript levels in 100 ng of RNA isolated from pooled epithelial or fiber cells (30–50 lenses) microdissected from wild-type P1 mouse lenses. Densitometric analyses of triplicate reactions. B. Immunoblot analysis of BNIP3L protein levels in 10 μg of total protein extracted from pooled epithelial or fiber cells (30–50 lenses) microdissected from wild-type P1 mouse lenses. Densitometric analyses of triplicate reactions. C. Mid-sagittal lens sections from wild-type P1 mice immunostained, for the BNIP3L (red) and co-stained with nuclear stain DAPI (blue). Low magnification images for P1 were obtained using the 10X objective, the scale bar is 200 μm. D-F High magnification images were taken from three regions of the lens to examine spatial distribution of BNIP3L in the fiber cells of the lens, images were obtained using the 40X objective, scale bar 10 μm.

