
Figure 5.
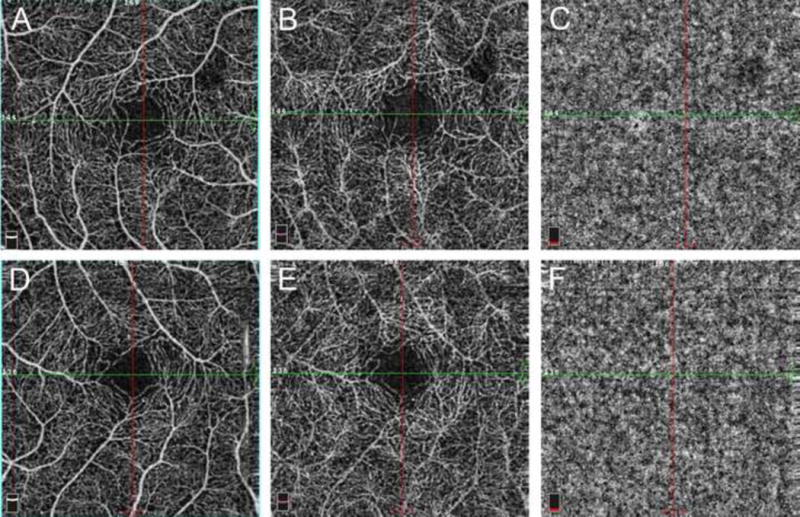
En face OCT angiography (OCT-A) of the central 3×3 mm taken at 1-week follow-up shows normal microvasculature in the right eye (A, B, C) and the left eye (D, E, F). A and D are segmented at the level of the superficial retinal capillary plexus. B and E are segmented at the level of the deep retinal capillary plexus. C and F are segmented at the level of the choriocapillaris.