
Figure 4.
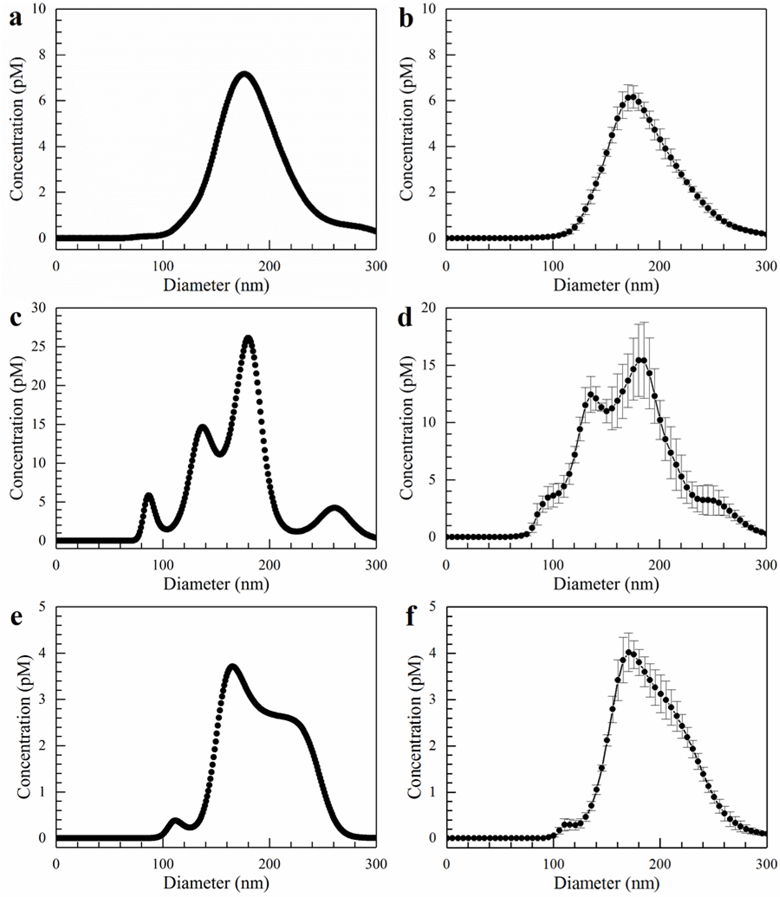
Size distributions for exosomes from blood serum. The flow rate was 150 µL/hr, and the field strength was 100 V/cm. a) Inlet single capture. b) Inlet average. c) Gel single capture. d) Gel average. e) Effluent single capture. f) Effluent average. Error bars represent the standard error with n = 5.