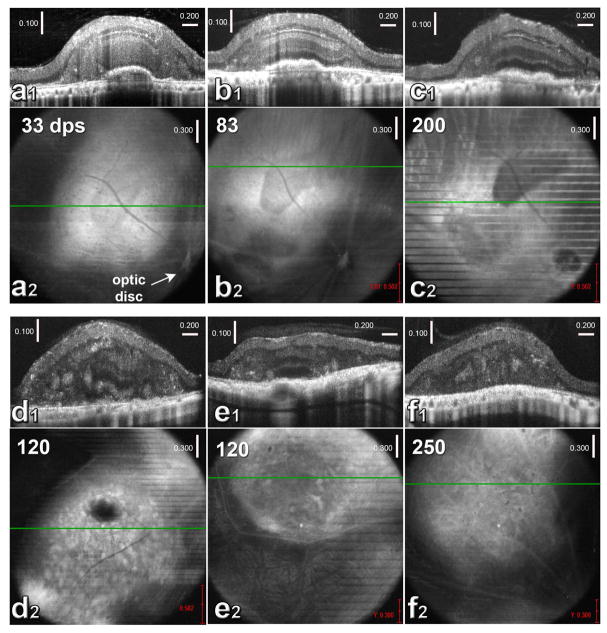
Figure 2. OCT imaging of HF retinal transplants in vivo (a1, b1, c1, d1, e1, f1).
Cross-sectional B-scans. (a2, b2, c2, d2, e2, f2): corresponding fundus images (maximum projections). The green lines indicate the positions of the B-scans (above).
(a–c) show the same transplant (rat #8) at different times post-transplantation. Dark area in the fundus image indicates cografted RPE.
(a1) B-scan and (a2) fundus image at 33 day post-surgery (dps). At this time, only IPL and outer NBL of the transplant are recognizable in B-scan. (b1) B-scan and (b2) fundus image of the same eye at 83 dps. All retinal layers are visible in B-scan. (c1) B-scan and (c2) fundus image of the same eye at 200 dps. All retinal layers and outer segments are recognizable in B-scan. This fundus image is a narrower projection of the B-scans to show the RPE co-graft more clearly. Lines indicate rat breathing movements during scan.
(d1) B-scan and (d2) fundus image of the eye of transplanted rat #7 at 120 dps. B-scan shows partial laminated structure in transplant. Rosettes are visible in both images (hyper-reflective spots). Optic disc is outside the fundus image.
(e1) B-scan and (e2) fundus image of rat #9 at 120 dps. In B-scan, the center of the transplant appears laminated. Rosettes are recognizable too.
(f1) B-scan and (f2) fundus images of rat #13 at 250 dps. Rosettes are visible. Scales in a1, b1, c1, d1, e1, and f1: vertical: 100 μm; horizontal: 200 μm.
Scales in a2, b2, c2, d2, e2, and f2: 300 μm.

