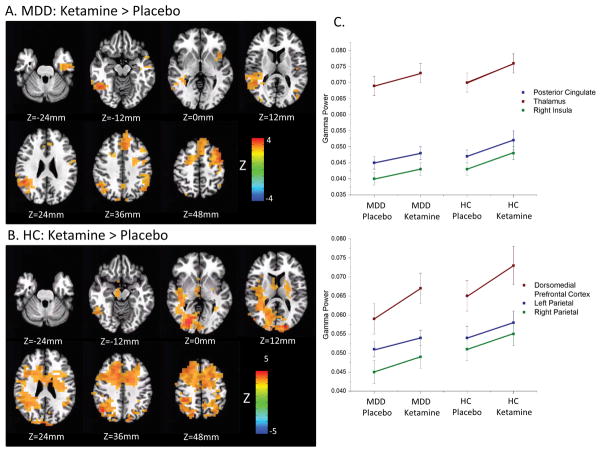
Figure 2.
Images of Ketamine-Day0 vs. Placebo-Day0 contrasts derived from the mixed model are shown for A) patients with major depressive disorder (MDD). Images are thresholded at a voxel-level threshold of p<0.01, which corresponds to pFDR=0.049. The same images are shown for B) healthy controls, where in order to differentiate regions of peak change, images are thresholded at a more restrictive voxel-level threshold of p<0.001, which corresponds to pFDR=0.0014. Gamma power was robustly increased in regions of the central executive network (CEN; Figure 2a,b Z=36mm), including bilateral parietal cortex, dorsomedial prefrontal cortex, and dorsolateral prefrontal cortex (DLPFC) in both groups. The MDD group exhibited increases in the insula, which is involved in the salience network (SN; Figure 2a, Z=0mm). Healthy control subjects exhibited increases in gamma power in the posterior cingulate and thalamus (Figure 2b, Z=0mm to 12mm), regions related to the default mode network (DMN). MDD subjects exhibited increases under ketamine in the inferior temporal cortex extending into the parahippocampal cortex (Figure 2a, Z=−24mm to −12mm). C) The plots of estimated marginal means from mixed models performed on regions of interest (ROIs) defined on the Ketamine-Day0 vs. Placebo-Day0 contrast collapsed across groups. Coordinates are given in Supplementary Table S7. Because these are functionally defined ROIs, effect sizes cannot be interpreted, although the general trend of MDD subjects exhibiting increases in gamma power following ketamine infusion to a level commensurate with that of the healthy controls following placebo infusion can be observed. HC: healthy control.

