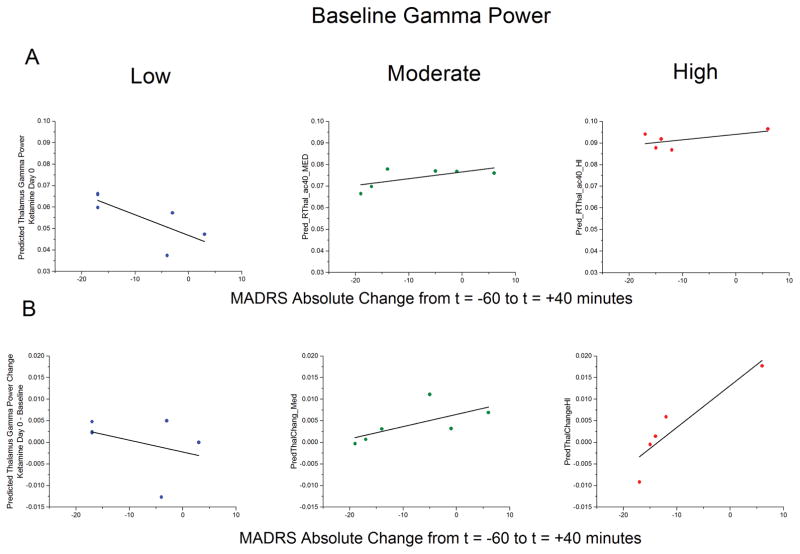
Figure 3.
A) Exploratory results in major depressive disorder (MDD) patients from a mixed model examining post-infusion gamma power in the right thalamus with baseline gamma power and change in Montgomery Åsberg Depression Rating Scale (MADRS) score as a covariate. Significant main effects were noted for both baseline gamma power (F1,12=224.8, p<0.001) and MADRS response (F1,12=32.6, p<0.001), as was a significant interaction between baseline gamma power and MADRS response (F1,12=47.46, p<0.001). The predicted values are plotted versus change in MADRS score from t=−60 to t=+40 following ketamine infusion for three groups of patients stratified by baseline gamma power to visualize the interaction. Note that subgroup stratification was performed here for visualization purposes only; baseline gamma power was a continuous variable in the statistical model. B) The same data from A (above), except with change in gamma power from baseline to ketamine sessions plotted along the y-axis; note that the statistical effects are the same.

